Original Research
Multidimensional Recovery Trajectories of the Paretic Shoulder During the First Year After Stroke: A Longitudinal Cohort Study
1 Department of Neuroscience, Rehabilitation, Ophthalmology, Genetics, Maternal and Child Health (DINOGMI), University of Genoa, 16132 Genoa, Italy
2 IRCCS Ospedale Policlinico San Martino, 16132 Genoa, Italy
3 Advanced School of Musculoskeletal Ultrasound, Italian Society of Ultrasound in Medicine and Biology (SIUMB), Postgraduate Course, Department of Clinical and Experimental Medicine, Santa Chiara University Hospital, University of Pisa, Pisa, Italy
4 UF Ortopedia, S. Rita Hospital, Montecatini Terme, PT, Italy
5 Advanced School of Musculoskeletal Ultrasound, Italian Society of Ultrasound in Medicine and Biology (SIUMB), San Giovanni Rotondo, Foggia, Italy
Corresponding author: Filippo Cotellessa · filippo_cotellessa@hotmail.it
Received 12 September 2026
Abstract
Background:
Recovery
of
the
paretic
shoulder
after
stroke
is
multidimensional:
voluntary
movement
may
improve
while
pain,
resistance
to
passive
movement,
and
loss
of
passive
mobility
emerge.
Objective:
To
characterize
changes
in
shoulder
range
of
motion
(ROM),
strength,
pain,
resistance
to
passive
movement,
and
upper-limb
disability
from
the
acute
phase
to
12
months
after
stroke.
Methods:
This
secondary
analysis
included
77
adults
with
first-ever
stroke
assessed
within
72
hours
and
at
1,
3,
6,
and
12
months.
Active
and
passive
shoulder
ROM,
Medical
Research
Council
(MRC)
strength,
movement-related
Numerical
Rating
Scale
(NRS)
pain,
Modified
Ashworth
Scale
(MAS)
resistance,
and
Disabilities
of
the
Arm,
Shoulder
and
Hand
(DASH)
scores
were
examined
using
random-intercept
mixed
models
and
clustered
logistic
models.
Within-person
associations,
exploratory
predictors
of
12-month
active
flexion,
attrition,
and
complete-case
sensitivity
analyses
were
also
evaluated.
Results:
Available
assessments
numbered
77,
69,
66,
60,
and
55.
Estimated
active
flexion
increased
from
47.3°
at
baseline
to
100.7°
at
12
months
(difference,
53.4°;
95%
confidence
interval
(CI),
41.3–65.4°;
p
<
0.001),
with
faster
improvement
during
the
first
3
months.
Strength
and
active
abduction
and
external
rotation
also
improved.
Passive
flexion
decreased
from
167.2°
to
142.9°
at
3
months
before
partially
recovering
to
154.8°
at
12
months.
Mean
pain
peaked
at
3
months
(NRS,
3.95),
when
the
model-estimated
probability
of
NRS
≥4
was
57.6%.
The
model-estimated
probability
of
MAS
>0
increased
from
9.1%
to
39.4%
and
was
36.4%
at
12
months.
DASH
improved
from
79.3
to
49.4.
Within-person
increases
in
active
flexion
and
strength
were
associated
with
lower
DASH,
whereas
greater
pain
was
associated
with
higher
DASH.
Baseline
active
flexion
predicted
12-month
flexion.
Participants
lost
to
follow-up
were
older
and
had
greater
baseline
stroke
severity.
Conclusions:
Shoulder
motor
recovery
was
greatest
early
but
continued
through
12
months,
whereas
passive
ROM,
pain,
and
resistance
to
passive
movement
followed
divergent
trajectories.
Repeated
multidimensional
assessment
is
warranted,
and
late
estimates
require
caution
because
of
selective
attrition.Keywords: Stroke; Shoulder; Upper Extremity; Range of Motion; Muscle Strength; Longitudinal Studies
Introduction
Stroke frequently leaves persistent impairment of the upper limb, limiting independence in daily activities [1, 2]. Initial motor severity is informative but does not fully account for the variation in later arm function [3, 4]. The shoulder is central to reaching and positioning the arm, yet recovery at this joint cannot be described by voluntary movement alone. A patient may regain active movement while developing pain, resistance to passive movement, or loss of available joint mobility. Following these dimensions together may reveal clinically important changes that a single global arm score cannot show.
Upper-limb motor recovery is usually fastest during the early months after stroke, although further gains can occur later [5, 6]. Early shoulder abduction and finger extension help predict subsequent arm capacity [3], and early active range of motion (ROM) has prognostic value for upper-limb function [7]. These findings establish the relevance of early motor assessment but give less detail on how active and passive shoulder mobility in different planes evolve alongside strength and other shoulder impairments. In particular, a narrowing difference between passive and active ROM can reflect improved voluntary control, declining passive mobility, or both; the measurements alone do not identify the underlying mechanism.
Pain adds a different temporal dimension. Prospective studies indicate that post-stroke shoulder pain may emerge after the acute phase and is associated with restricted movement and poorer function [8, 9]. More recent longitudinal work has described heterogeneous upper-extremity pain trajectories during the first year [10]. Clinical and ultrasonographic findings on pain from the present cohort have already been published [11]. That report examined the timing and correlates of hemiplegic shoulder pain, including structural abnormalities; the present secondary analysis instead focuses on the course of shoulder movement and strength, their divergence from passive mobility and pain, and their relationship with perceived upper-limb disability. Reusing the cohort for this distinct question also permits the previously reported pain trajectory to be interpreted alongside motor recovery without repeating the ultrasound analysis.
Resistance encountered during passive movement may develop alongside weakness, pain, and limited ROM. The Modified Ashworth Scale (MAS) grades this resistance, but its ordinal scores do not distinguish reflex-mediated spasticity from non-neural stiffness or contracture [12, 13]. Concurrent assessment of MAS, active and passive ROM, and pain can therefore describe how impairments coexist over time, while avoiding a mechanism-specific interpretation that these clinical measurements cannot support.
Patient-reported disability provides a further perspective because gains on examination need not translate proportionally into easier daily activities. The Disabilities of the Arm, Shoulder and Hand (DASH) questionnaire has acceptable construct validity after stroke, although its reliability and application in severe neurological impairment require caution [14]. Examining its longitudinal association with movement, strength, and pain can help determine whether changes in these clinical domains accompany changes perceived by patients, without establishing causation.
The primary aim was to characterize active shoulder-flexion ROM from the first 72 hours to 12 months after stroke. Flexion was chosen because it directly reflects the ability to elevate and position the paretic arm. Secondary aims were to describe active and passive flexion, abduction, and external rotation together with strength, resistance to passive movement, pain, and DASH scores; to compare their temporal patterns; and to examine within-person associations of movement, strength, and pain with disability. We also explored whether age, baseline stroke severity, and initial active flexion were associated with flexion at 12 months.
We expected active ROM and strength to improve most rapidly early after stroke, while pain and resistance to passive movement would follow different trajectories. We further expected improvements in active movement and strength to accompany lower disability, and increasing pain to accompany higher disability. Associations with the 12-month outcome were considered exploratory rather than the basis for an individual prediction model.
Materials and methods
Study design and ethical approval
This study was a secondary analysis of the prospectively collected dataset from the primary longitudinal clinical-ultrasonographic cohort reported by Cotellessa et al. [11]. The present analysis addressed a distinct clinical question by characterizing the multidimensional recovery of shoulder active and passive mobility, strength, resistance to passive movement, pain, and self-reported upper-limb disability. No ultrasonographic variables were included in the present analysis.
The study was conducted at IRCCS Ospedale Policlinico San Martino, Genoa, Italy. The Regional Ethics Committee of Liguria approved the protocol (N. CET-Liguria 254/2024; database identifier 13923) on October 14, 2024. The study followed the principles of the Declaration of Helsinki, and all participants provided written informed consent before enrollment.
Participants
Consecutive patients aged 18 years or older admitted between October 18 and December 31, 2024, with a first-ever ischemic or hemorrhagic stroke were screened. Patients were eligible when stroke onset had occurred within the previous 72 hours and a contralateral motor deficit was clinically confirmed during testing against gravity. Exclusion criteria were severe impairment of consciousness, cognitive or behavioral disturbances that prevented reliable participation in the assessments, and shoulder pain predating the stroke. Seventy-seven patients met the eligibility criteria and were enrolled.
Follow-up and clinical care
Clinical assessments were performed within 72 hours of stroke onset (T0) and at 1 month (T1), 3 months (T2), 6 months (T3), and 12 months (T4). Eight participants did not return at T1, three additional participants were lost before T2, six before T3, and five before T4, resulting in 77, 69, 66, 60, and 55 available assessments, respectively. The parent cohort report documented seven deaths, one relocation, and 14 withdrawals because follow-up was considered burdensome [11].
The study was observational and did not modify clinical management. Participants received rehabilitation, positioning, mobilization, pharmacological treatment, and other shoulder-pain interventions according to individual clinical needs and routine practice. Treatment exposure was therefore not standardized or assigned by the study protocol.
Clinical assessments
Active and passive shoulder ROM were measured with a manual goniometer during flexion, abduction, and external rotation. Flexion and abduction were referenced to a physiological range of 0–180°, and external rotation to 0–80°. When the shoulder could not reach the neutral external-rotation position, the deficit from neutral was recorded as a negative value. In contrast to the previously published pain-focused analysis, which used a normalized composite mobility index [11], the present study retained the measurements in degrees and analyzed each movement plane separately. The passive-minus-active difference was also calculated within each plane to quantify the available mobility not achieved voluntarily.
Shoulder strength was graded separately for flexion, abduction, and external rotation using the Medical Research Council (MRC) scale, ranging from 0 (no visible or palpable contraction) to 5 (normal strength) [15]. Resistance to passive movement was graded during shoulder extension, adduction, and internal rotation using the Modified Ashworth Scale (MAS; 0–4). These directions differ from the flexion, abduction, and external rotation used for strength and mobility assessment. The clinical grade 1+ was coded as 1.5 for data harmonization, while longitudinal inferential models used the binary presence of any resistance (MAS >0), without assuming equal intervals between MAS categories.
Movement-related shoulder pain was assessed during passive flexion, abduction, and external rotation using an 11-point Numerical Rating Scale (NRS), ranging from 0 (no pain) to 10 (worst imaginable pain) [16]. Scores were recorded separately for each direction, and the highest of the three values represented maximum movement-related pain at that assessment. A binary NRS ≥4 outcome was additionally derived to describe the prevalence of more substantial pain and to maintain comparability with the previous cohort report [11].
Self-reported upper-limb disability was evaluated using the Disabilities of the Arm, Shoulder and Hand questionnaire, scored from 0 to 100, with higher scores indicating greater disability [14]. Stroke severity was measured at baseline using the National Institutes of Health Stroke Scale (NIHSS), ranging from 0 to 42, with higher scores indicating greater neurological impairment [17]. ROM, strength, resistance to passive movement, pain, and DASH were assessed at each follow-up; NIHSS was recorded only at T0.
Statistical analysis
Continuous variables were summarized using mean and standard deviation and, when distributions were markedly skewed or bounded, median and interquartile range. Categorical variables were summarized as counts and percentages. Follow-up completeness was reported at each assessment. All analyses used the available observations at T0 (≤72 hours), T1 (1 month), T2 (3 months), T3 (6 months), and T4 (12 months).
The primary outcome was active shoulder-flexion range of motion. Its longitudinal trajectory was examined using a linear mixed-effects model with a patient-specific random intercept and follow-up time entered as a five-level categorical fixed effect. The random intercept accounted for within-patient correlation, while categorical coding avoided imposing a linear recovery trajectory. Parameters were estimated by restricted maximum likelihood. Model-based marginal means with 95% confidence intervals (CIs) were calculated at each assessment. The overall time effect was evaluated using a four-degree-of-freedom Wald chi-square test. Planned contrasts compared each follow-up with T0 and each successive follow-up interval. Contrast p values were adjusted within each outcome using the Holm procedure [18]. Mixed-effects models were selected because they account for correlated repeated observations and allow participants with incomplete follow-up to contribute all available data [19].
To quantify whether recovery velocity differed between the early and later phases, a secondary piecewise mixed-effects model was fitted for active flexion. Time was represented by two continuous terms corresponding to 0–3 months and 3–12 months. The model estimated the monthly slope in each phase and directly tested the difference between the two slopes.
The same categorical-time mixed-model framework was applied to passive flexion, active and passive abduction and external rotation, maximum movement-related pain intensity, DASH score, and strength in each movement plane. Strength was recorded on the ordinal MRC scale; analyses treating MRC scores as approximately continuous were therefore considered secondary and were interpreted as average score trajectories rather than interval-level physiological changes. Floor and ceiling distributions were examined descriptively.
For each visit, maximum movement-related pain was defined as the highest NRS value recorded during flexion, abduction, or external rotation. A binary pain outcome was defined as a maximum NRS score ≥4. Three binary longitudinal outcomes were examined: pain with NRS ≥4, the presence of any active movement in at least one plane, and resistance to passive movement defined as MAS >0 in at least one plane. Binary outcomes were analyzed using logistic regression with categorical time and patient-clustered sandwich standard errors. Model-based probabilities and 95% confidence intervals were reported. MAS grade 1+ was harmonized as 1.5 in the analysis dataset; however, because MAS is ordinal and non-equidistant, the inferential analysis used the binary presence of resistance rather than arithmetic mean MAS values [13].
To control multiplicity across secondary outcomes, Benjamini–Hochberg false discovery rate (FDR) adjustment was applied separately to the global tests for the continuous and binary outcome families [20]. Holm-adjusted values were used for the planned within-outcome contrasts. Multiplicity-adjusted results were interpreted together with effect estimates and 95% confidence intervals.
Associations with disability were examined using separate random-intercept mixed models for active flexion, flexion strength, and maximum NRS. Each time-varying predictor was decomposed into a patient-specific mean and a within-patient deviation from that mean. This separation allowed the within-person coefficient to represent the association between an individual’s change in the clinical measure and concurrent change in DASH, independently of stable between-patient differences. Models were additionally adjusted for categorical follow-up time. Active flexion was scaled per 10°; strength and pain were scaled per one-point increase.
An exploratory model examined active flexion at 12 months using baseline active flexion (per 10°), NIHSS score (per five points), and age (per 10 years) as predictors. Ordinary least-squares regression with heteroscedasticity-consistent HC3 standard errors was used because this analysis included one outcome observation per participant. The model was intended for association and hypothesis generation and was not developed or validated as an individual prognostic model.
Potential attrition bias was examined by comparing baseline characteristics of participants with and without a T4 assessment. Continuous variables were compared using the Mann–Whitney U test and categorical variables using Fisher’s exact test. As a sensitivity analysis, the primary mixed model was repeated in participants who completed all five assessments. No single-value imputation was performed. Likelihood-based mixed models can provide valid inference under a missing-at-random assumption conditional on observed data; because participants lost to T4 differed in age and baseline NIHSS, this assumption cannot be verified and late follow-up estimates were interpreted cautiously.
Tests were two-sided and statistical significance was set at p < 0.05. Analyses were performed in Python 3.12 using NumPy 2.3.5, pandas 2.2.3, and SciPy 1.17.0. The analysis code and pseudonymized dataset were retained and are subject to the access conditions stated below.
Results
Participants and follow-up completeness
Seventy-seven patients were included in the longitudinal cohort. All patients were assessed during the acute phase (T0), while 69 (89.6%), 66 (85.7%), 60 (77.9%), and 55 (71.4%) contributed data at 1, 3, 6, and 12 months, respectively. The cohort had a mean age of 68.6 ± 10.9 years and a median baseline NIHSS score of 12 (interquartile range [IQR], 8–16). Twenty-four patients (31.2%) were women, 53 (68.8%) had an ischemic stroke, and 49 (63.6%) had right-sided paresis. At baseline, the median active shoulder-flexion range was 0° (IQR, 0–80°), despite a median passive range of 180° (IQR, 160–180°), indicating a marked initial discrepancy between available joint mobility and voluntary movement. Baseline characteristics and follow-up completeness are summarized in Table 1.
DASH, Disabilities of the Arm, Shoulder and Hand; IQR, interquartile range; MRC, Medical Research Council scale; NIHSS, National Institutes of Health Stroke Scale; T0, ≤72 hours; T1, 1 month; T2, 3 months; T3, 6 months; T4, 12 months.
Primary outcome: active shoulder flexion
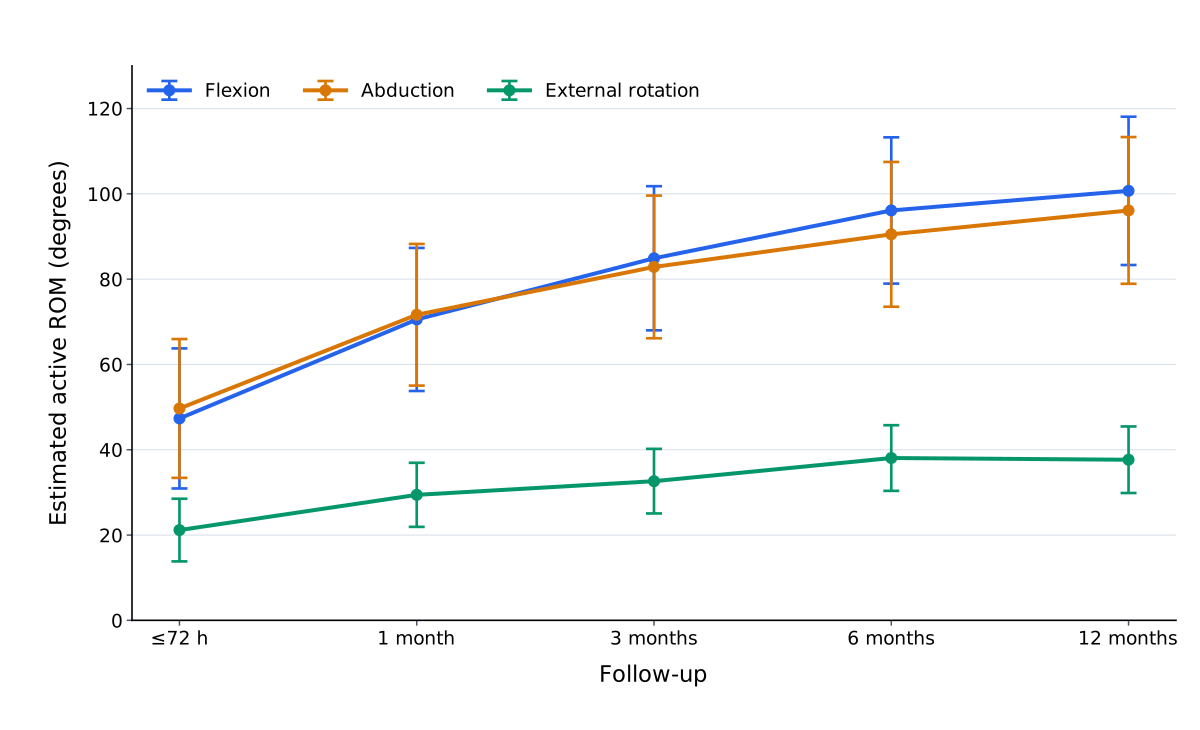
Active shoulder flexion changed significantly over time (Wald χ²[4] = 102.72, p < 0.001). The model-estimated marginal mean increased from 47.3° (95% CI, 30.9–63.8°) at T0 to 70.5° (95% CI, 53.8–87.3°) at 1 month, 84.9° (95% CI, 68.0–101.8°) at 3 months, 96.1° (95% CI, 79.0–113.2°) at 6 months, and 100.7° (95% CI, 83.3–118.1°) at 12 months. Compared with baseline, the adjusted improvement was 23.2° at 1 month, 37.6° at 3 months, 48.8° at 6 months, and 53.4° at 12 months; all baseline contrasts remained significant after Holm correction. The T2–T1 increment was also significant (+14.3°; 95% CI, 2.9–25.8°; Holm-adjusted p = 0.041), whereas the T3–T2 and T4–T3 increments were not individually significant after correction, consistent with a progressive slowing of recovery.
The piecewise model confirmed this temporal pattern. Active flexion increased by an estimated 12.5° per month during the first 3 months (95% CI, 9.0–15.9°; Holm-adjusted p < 0.001), compared with 1.4° per month between 3 and 12 months (95% CI, 0.1–2.8°; Holm-adjusted p = 0.036). The difference between the early and late slopes was 11.0° per month (95% CI, 6.7–15.3°; Holm-adjusted p < 0.001). Thus, recovery continued after 3 months, but at a substantially lower rate (Figure 1).
Active and passive range of motion
Active abduction and external rotation also improved significantly over time (both FDR-adjusted p < 0.001). Estimated active abduction increased from 49.7° at T0 to 96.1° at T4, while external rotation increased from 21.2° to 37.7° (Table 2). The trajectories were not identical: flexion and abduction continued to show numerically higher values through T4, whereas external rotation reached 38.1° at 6 months and remained essentially stable thereafter.
Passive range of motion followed a different trajectory. Passive flexion decreased from 167.2° at T0 to 142.9° at 3 months and subsequently partially recovered to 154.8° at 12 months. Similar U-shaped patterns were observed for passive abduction and external rotation. Time effects remained significant for all three passive movements after FDR correction. Consequently, the initially large passive–active gap narrowed markedly during follow-up, primarily because active mobility improved while passive mobility transiently declined during the first 3 months.
Values are estimated marginal means (95% confidence intervals) from random-intercept linear mixed models. FDR, false discovery rate. T0, ≤72 hours; T1, 1 month; T2, 3 months; T3, 6 months; T4, 12 months.
Muscle strength and presence of voluntary movement
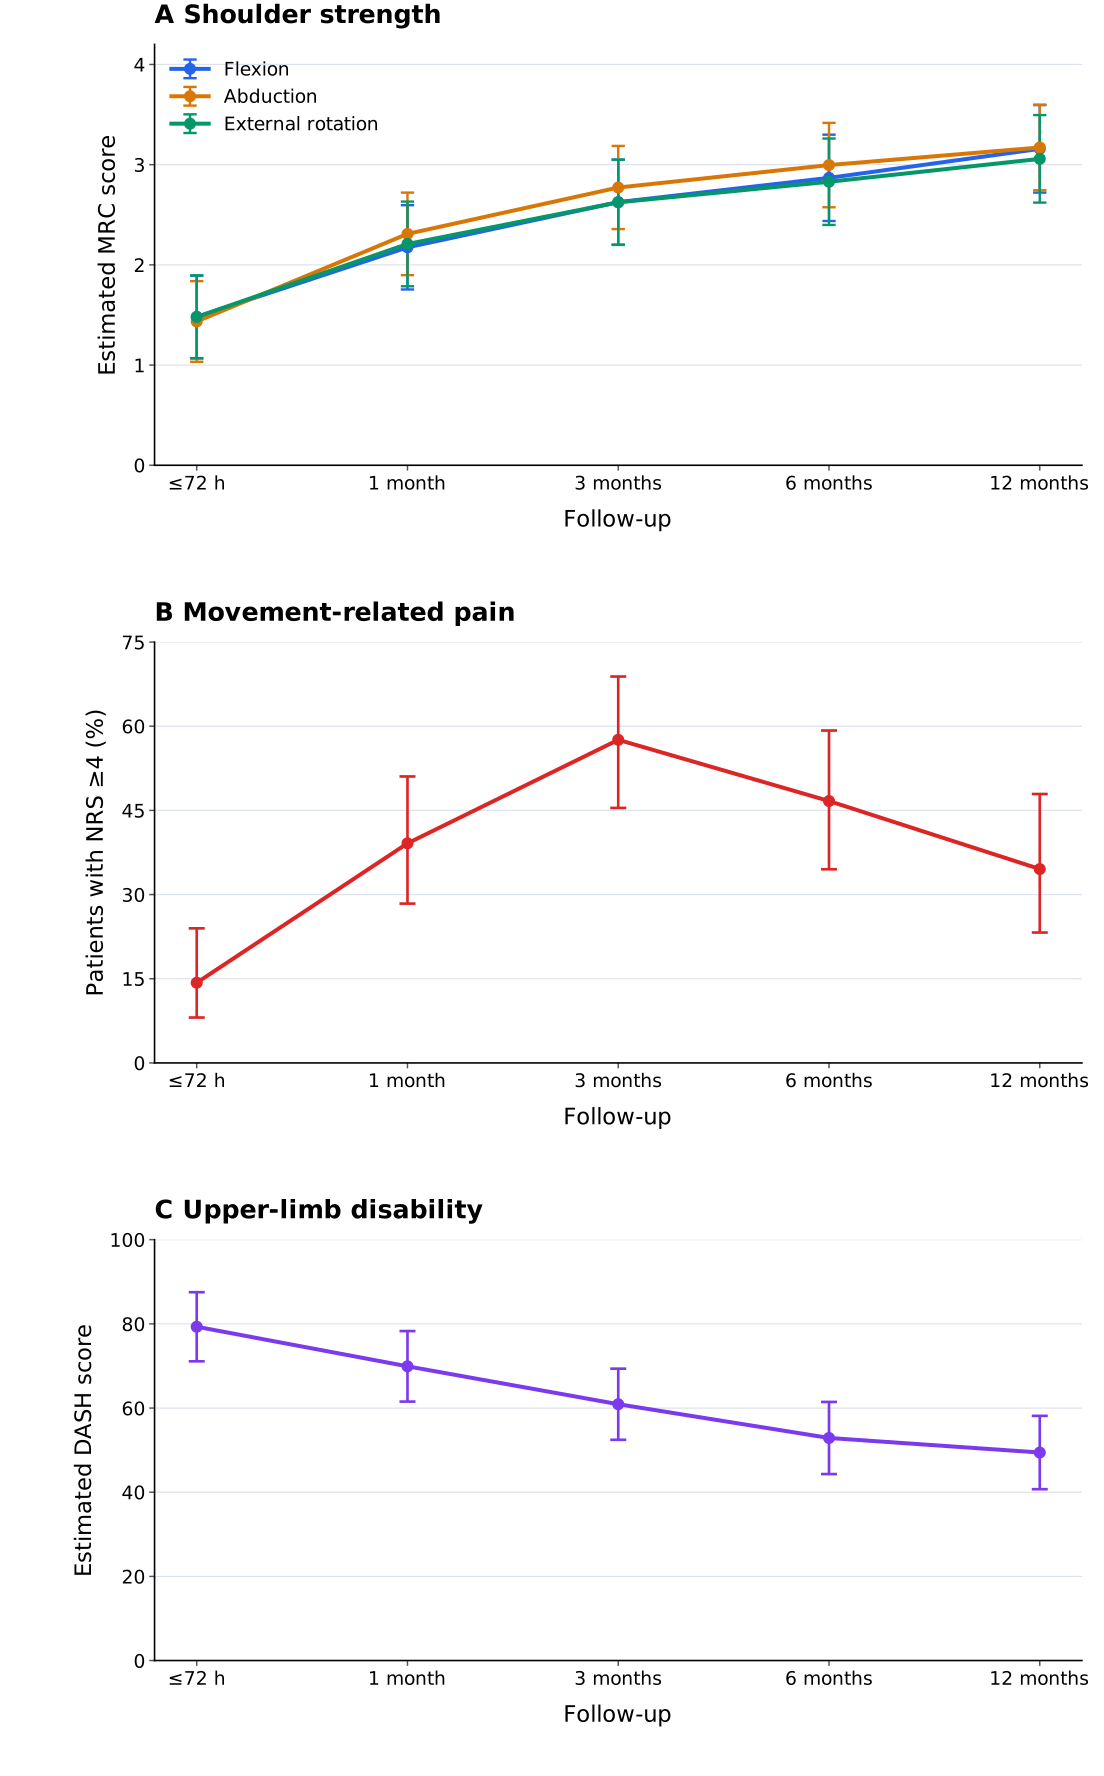
Strength improved substantially in all movement planes (all FDR-adjusted p < 0.001). Estimated flexion strength increased from 1.48 at T0 to 3.16 at T4, abduction strength from 1.44 to 3.17, and external-rotation strength from 1.48 to 3.06 on the MRC scale. The model-estimated probability of demonstrating at least some active movement in one or more planes increased from 44.2% (95% CI, 33.5–55.4%) at T0 to 81.8% (95% CI, 69.4–89.9%) at T4 (global p < 0.001). The largest gains occurred during the first 3 months, followed by smaller improvements thereafter (Figure 2).
Pain and resistance to passive movement
Pain showed a trajectory that clearly diverged from motor recovery. Mean maximum movement-related NRS increased from 0.95 (95% CI, 0.31–1.59) at T0 to 2.53 (95% CI, 1.86–3.20) at 1 month and peaked at 3.95 (95% CI, 3.27–4.63) at 3 months. It subsequently decreased to 3.35 at 6 months and 2.81 at 12 months, although the 12-month estimate remained higher than the acute-phase value. The overall time effect was significant after FDR correction (p < 0.001).
Using a maximum NRS score ≥4 in any tested movement, the model-estimated probability of the binary pain outcome was 14.3% at T0, 39.1% at T1, 57.6% at T2, 46.7% at T3, and 34.5% at T4 (global p < 0.001). This temporal pattern was consistent with the previously reported pain-focused analysis of the cohort [11]. Resistance to passive movement, defined as a Modified Ashworth Scale score >0 in at least one movement, had model-estimated probabilities of 9.1% at baseline, 39.4% at 3 months, and 36.4% at 12 months (global p < 0.001). Because the Modified Ashworth Scale is ordinal, results were expressed as model-estimated probabilities of any resistance rather than interpreting arithmetic score differences as equal-interval changes.
Upper-limb disability
DASH scores decreased significantly over time (Wald χ²[4] = 131.74; FDR-adjusted p < 0.001), from an estimated mean of 79.3 (95% CI, 71.1–87.5) at T0 to 69.9 at T1, 60.9 at T2, 52.9 at T3, and 49.4 (95% CI, 40.7–58.1) at T4. The adjusted T4–T0 reduction was 29.9 points (95% CI, 23.9–35.9 points; Holm-adjusted p < 0.001). Reductions were significant during the T0–T1, T1–T2, and T2–T3 intervals, whereas the additional reduction between 6 and 12 months was not significant after correction (−3.5 points; 95% CI, −9.6 to 2.7; p = 0.271).
Continuous values are estimated marginal means (95% confidence intervals). Binary values are model-estimated probabilities, not observed proportions (95% confidence intervals). Global adjusted p values use the Benjamini–Hochberg procedure within the relevant outcome family. DASH, Disabilities of the Arm, Shoulder and Hand; MAS, Modified Ashworth Scale; MRC, Medical Research Council scale; NRS, Numerical Rating Scale.
Longitudinal associations with disability
Within-person analyses adjusted for follow-up time demonstrated that changes in shoulder status were associated with concurrent changes in disability. Each 10° within-patient increase in active flexion was associated with a 2.79-point reduction in DASH (95% CI, 2.26–3.31; Holm-adjusted p < 0.001). Each one-point increase in flexion strength was associated with a 9.43-point reduction in DASH (95% CI, 7.28–11.58; Holm-adjusted p < 0.001). Conversely, each one-point increase in maximum movement-related NRS was associated with a 1.42-point increase in DASH (95% CI, 0.52–2.33; Holm-adjusted p = 0.002). These coefficients represent longitudinal associations and should not be interpreted as causal effects.
Exploratory predictors, attrition, and sensitivity analyses
In the exploratory model of 12-month active flexion (n = 55), every additional 10° of baseline active flexion was associated with 5.0° greater active flexion at T4 (95% CI, 2.6–7.3°; p < 0.001). Baseline NIHSS (per 5-point increase: β = −10.6°; 95% CI, −33.3 to 12.1°; p = 0.353) and age (per 10-year increase: β = −4.5°; 95% CI, −25.9 to 16.9°; p = 0.675) were not independently associated with the outcome in this sample. The model explained approximately 40% of the observed variance but was exploratory and was not validated for individual prediction.
Patients assessed at T4 were younger than those without a 12-month assessment (median, 69.0 vs 72.5 years; p = 0.013) and had lower baseline NIHSS scores (median, 10.0 vs 15.5; p = 0.031). Baseline active flexion and DASH did not differ significantly between these groups. A complete-case analysis restricted to the 55 patients with all five assessments confirmed the direction and magnitude of active-flexion recovery, with observed means increasing from 53.3° at T0 to 105.9° at T4. Nevertheless, the age and severity differences associated with follow-up completion indicate that late estimates may overrepresent patients with a more favorable recovery profile.
Discussion
This secondary analysis examined how several dimensions of paretic-shoulder recovery evolve together during the first year after stroke. Using five assessments from the first 72 hours to 12 months, we analyzed active and passive movement, strength, resistance to passive movement, pain, and patient-reported disability in the same 77-person cohort. The rationale was that improvement in voluntary movement may coexist with painful or mechanical limitations that are obscured when recovery is represented by a single arm score. The main finding was a divergence between domains: active mobility and strength improved most rapidly in the first 3 months and continued to improve more slowly thereafter, while passive mobility declined early and recovered only partially. Pain and resistance to passive movement became more common after the acute phase, and within-person changes in movement, strength, and pain were each associated with concurrent disability.
The active-movement trajectory accords with longitudinal evidence that upper-limb recovery is fastest early after stroke but may continue into the chronic phase [5, 6]. Active flexion increased by approximately 53° from baseline to 12 months, with a substantially steeper modeled slope during months 0–3 than during months 3–12. Abduction followed a similar course, whereas external rotation showed a smaller absolute gain and little further change after 6 months. Differences among movement planes may reflect varying demands on selective control, shoulder muscle activation, scapulohumeral coordination, and pain, but these mechanisms were not measured here. Our movement-specific findings extend earlier work on the prognostic value of active ROM [7] by showing when different shoulder movements changed rather than reducing them to a composite upper-limb outcome. The smaller late gains also caution against treating the 3-month assessment as the endpoint of recovery.
Passive ROM followed a contrasting course. Flexion, abduction, and external rotation decreased during the first 3 months and then improved without returning to their acute-phase estimates at 12 months. The narrowing gap between passive and active ROM therefore reflected both improved voluntary movement and, initially, reduced available passive mobility. It cannot be interpreted solely as motor recovery. Pain-limited examination, increased resistance, soft-tissue shortening, capsular or periarticular changes, positioning, and treatment may all have contributed; our clinical measurements cannot separate these possibilities. The timing of reduced passive mobility coincided with the peak in movement-related pain and increasing resistance, consistent with the pain-focused clinical and ultrasound report from this same cohort [11]. This temporal concurrence supports monitoring passive movement even when active performance is improving, without establishing that one change caused another.
Movement-related pain was uncommon during acute assessment, reached its highest level at 3 months, and remained clinically relevant for a substantial minority at 12 months. This pattern is consistent with prospective reports that shoulder pain may develop after the initial stroke and accompany poorer arm outcomes [8–10]. Resistance to passive movement, indicated by a MAS score above zero, also increased during follow-up. The MAS records resistance encountered during passive movement; it does not isolate reflex-mediated spasticity from non-neural stiffness or contracture [12, 13]. Thus, the parallel emergence of pain, passive restriction, and resistance identifies a period requiring clinical attention, while leaving the underlying mechanisms unresolved. Future studies with instrumented assessment, imaging, and recorded treatment exposure could test their respective contributions.
Patient-reported disability improved by approximately 30 DASH points across the year. In separate time-adjusted models, within-person gains in active flexion and flexion strength were associated with lower DASH scores, whereas greater movement-related pain was associated with higher scores. These associations relate concurrent changes within individuals; the models did not estimate mutually adjusted effects of all three measures, and they cannot determine whether better movement led to greater arm use, whether use promoted movement, or how pain influenced either process. The DASH adds the patient perspective to impairment measures, although it was developed for musculoskeletal conditions and has recognized limitations in severe stroke [14]. Neither shoulder examination nor DASH alone describes distal dexterity, real-world arm use, or participation.
Baseline active flexion was associated with 12-month flexion in the exploratory analysis, in keeping with evidence that early voluntary motor performance helps characterize later upper-limb outcome [3, 4, 7]. Age and baseline NIHSS score were not independently associated with 12-month flexion in this model, but their wide confidence intervals do not rule out clinically relevant effects. The analysis included only 55 participants with a final assessment and was neither developed nor validated as an individual prediction tool. Clinically, the results favor repeated assessment of active and passive ROM, strength, pain, and resistance as separate domains: early motor gains should be documented alongside surveillance for complications, and ongoing gains after 3 months can inform later rehabilitation goals.
Acute-phase enrollment, five assessments over 12 months, and concurrent measurement of complementary shoulder domains are strengths of this study. Its principal limitations are the single-center secondary design, modest sample, and selective attrition: participants without a 12-month assessment were older and had more severe strokes, so the missing-at-random assumption is uncertain and late estimates may favor better-recovering patients. No kinematic, electrophysiological, biomechanical, distal motor, or activity-based measures were available to establish mechanisms or the translation of shoulder changes into everyday arm performance.
Conclusions
Over the first year after stroke, improvement in voluntary shoulder movement coexisted with an early decline in passive mobility and a delayed burden of pain and resistance to passive movement. These different trajectories support repeated assessment of each domain rather than inferring overall shoulder recovery from a single measure. The late estimates should be interpreted cautiously because follow-up was incomplete and selective.
Declarations
Funding
No specific funding was received for this secondary analysis.
Conflicts of interest
The authors declare no conflicts of interest.
Ethics approval
The Regional Ethics Committee of Liguria approved the study protocol (N. CET-Liguria 254/2024; database identifier 13923) on October 14, 2024.
Data/code availability
Participant-level data are not publicly available because of ethical and privacy restrictions. A pseudonymized dataset and analysis code may be made available by the corresponding author upon reasonable request, subject to the ethics approval and institutional data-governance requirements.
Registration
Not applicable; this is a secondary analysis of an observational cohort.
Generative AI disclosure
No generative AI tools were used.
CRediT contributor roles
Filippo Cotellessa: Conceptualization, Methodology, Formal analysis, Data curation, Visualization, Writing – original draft. Maria Cesarina May: Investigation, Data curation, Writing – review & editing. Riccardo Pedrini: Investigation, Resources, Writing – review & editing. Salvatore Massimo Stella: Investigation, Validation, Writing – review & editing. Annarita Saponara: Investigation, Writing – review & editing. Gianni Nucci: Investigation, Writing – review & editing. William Campanella: Methodology, Supervision, Writing – review & editing.
References
[1]
GBD 2019 Stroke Collaborators. Global, regional, and national burden of stroke and its risk factors, 1990–2019: A systematic analysis for the global burden of disease study 2019. Lancet Neurology. 2021;20:795–820.
https://doi.org/10.1016/S1474-4422(21)00252-0
[2]
Kwakkel G, Kollen BJ, Grond J van der, Prevo AJH. Probability of regaining dexterity in the flaccid upper limb: Impact of severity of paresis and time since onset in acute stroke. Stroke. 2003;34:2181–6.
https://doi.org/10.1161/01.STR.0000087172.16305.CD
[3]
Nijland RHM, Wegen EEH van, Harmeling-van der Wel BC, Kwakkel G, EPOS Investigators. Presence of finger extension and shoulder abduction within 72 hours after stroke predicts functional recovery. Stroke. 2010;41:745–50.
https://doi.org/10.1161/STROKEAHA.109.572065
[4]
Stinear CM, Byblow WD, Ackerley SJ, Smith MC, Borges VM, Barber PA.
PREP2: A biomarker-based algorithm for predicting upper limb function after stroke. Annals of Clinical and Translational Neurology. 2017;4:811–20.
https://doi.org/10.1002/acn3.488
[5]
Borschmann KN, Hayward KS. Recovery of upper limb function is greatest early after stroke but does continue to improve during the chronic phase: A two-year, observational study. Physiotherapy. 2020;107:216–23.
https://doi.org/10.1016/j.physio.2019.10.001
[6]
Thrane G, Sunnerhagen KS, Alt Murphy M. Upper limb kinematics during the first year after stroke: The stroke arm longitudinal study at the university of gothenburg (
SALGOT). Journal of NeuroEngineering and Rehabilitation. 2020;17:76.
https://doi.org/10.1186/s12984-020-00705-2
[9]
Adey-Wakeling Z, Arima H, Crotty M, Leyden J, Kleinig T, Anderson CS, others. Incidence and associations of hemiplegic shoulder pain poststroke: Prospective population-based study. Archives of Physical Medicine and Rehabilitation. 2015;96:241–247.e1.
https://doi.org/10.1016/j.apmr.2014.09.007
[11]
Cotellessa F, May MC, Guzzone V, Puce L, Picasso R, Pedrini R, others. Temporal trajectory and predictors of hemiplegic shoulder pain after stroke: A 12-month longitudinal clinical-ultrasound study. European Journal of Physical and Rehabilitation Medicine. 2026;62:347–58.
https://doi.org/10.23736/S1973-9087.26.09443-8
[13]
Pandyan AD, Price CI, Barnes MP, Johnson GR. A biomechanical investigation into the validity of the modified ashworth scale as a measure of elbow spasticity. Clinical Rehabilitation. 2003;17:290–3.
https://doi.org/10.1191/0269215503cr610oa
[14]
Dalton E, Lannin NA, Laver K, Ross L, Ashford S, McCluskey A, others. Validity, reliability and ease of use of the disabilities of arm, shoulder and hand questionnaire in adults following stroke. Disability and Rehabilitation. 2017;39:2504–11.
https://doi.org/10.1080/09638288.2016.1229364
[15]
Medical Research Council. Aids to the examination of the peripheral nervous system. London: Her Majesty’s Stationery Office; 1976. (Memorandum no. 45).
[16]
Farrar JT, Young JP, LaMoreaux L, Werth JL, Poole RM. Clinical importance of changes in chronic pain intensity measured on an 11-point numerical pain rating scale. Pain. 2001;94:149–58.
https://doi.org/10.1016/S0304-3959(01)00349-9
[17]
Brott T, Adams HP, Olinger CP, Marler JR, Barsan WG, Biller J, others. Measurements of acute cerebral infarction: A clinical examination scale. Stroke. 1989;20:864–70.
https://doi.org/10.1161/01.STR.20.7.864
[18]
Holm S. A simple sequentially rejective multiple test procedure. Scandinavian Journal of Statistics. 1979;6:65–70.
[19]
Gueorguieva R, Krystal JH. Move over
ANOVA: Progress in analyzing repeated-measures data and its reflection in papers published in the archives of general psychiatry. Archives of General Psychiatry. 2004;61:310–7.
https://doi.org/10.1001/archpsyc.61.3.310