Original Research
Time Course and Individual Heterogeneity of Disability Recovery After Spine Surgery: A Secondary Analysis of the SPINEREG Cohort
1 IRCCS Ospedale Policlinico San Martino, 16132 Genoa, Italy
2 Department of Integrated Surgical Diagnostic Sciences (DISC), Orthopedic Clinic, University of Genoa, 16132 Genoa, Italy
Corresponding author: Maria Cesarina May · m_may_93@web.de
Journal of Movement & Neuromuscular Science · ISSN 3103-9286 · 2026 · Volume 1 · Issue 1 · Published 2026-10-19
Received 13 July 2026Revised 25 September 2026Accepted 16 October 2026Published online 19 October 2026
Article files
Article and supplementary files.
Abstract
Background: Recovery after spine surgery is longitudinal, yet outcome
studies often reduce repeated patient-reported measurements to a single
follow-up value. The original SPINEREG analysis combined 6-, 12-, and
24-month Oswestry Disability Index (ODI) measurements using last
observation carried forward (LOCF). We reanalyzed the open cohort while
preserving the recorded assessment times.
Methods: This secondary analysis included 1,392 adults undergoing
noncervical spine surgery. ODI was modeled from preoperative assessment
through 6, 12, and 24 months using a linear mixed-effects model with
categorical time and participant-specific random intercepts.
Prespecified secondary analyses evaluated hemoglobin-by-time and
diagnosis-by-time interactions and threshold-defined response using at
least 30% or 12.7-point ODI reduction. Gaussian generalized estimating
equations (GEE), complete-case analysis, inverse-probability-weighted
GEE, and direct paired comparisons assessed robustness to model choice
and incomplete follow-up.
Results: Model-estimated ODI decreased from 46.84 preoperatively to
23.61 at 6 months, 22.22 at 12 months, and 21.10 at 24 months. The
6-month reduction was 23.23 points (95% CI 22.08 to 24.39), representing
90.3% of the model-estimated baseline-to-24-month improvement.
Additional average change was small: 12 versus 6 months, -1.39 points
(Holm-adjusted p=0.064); 24 versus 12 months, -1.11 points (p=0.117);
and 24 versus 6 months, -2.50 points (Holm-adjusted p=0.002).
Sensitivity analyses showed the same pattern. Hemoglobin did not modify
the postoperative trajectory (interaction p=0.951), and
diagnosis-by-time was not significant (p=0.442), although postoperative
ODI remained higher after surgery for spinal deformity than for disc
disease. At least 30% improvement was observed in 70.5%, 75.4%, and
77.0% of observed patients at 6, 12, and 24 months; among 254 complete
cases, 28.7% changed responder state at least once.
Conclusions: In this heterogeneous surgical cohort, most average
disability improvement was already evident by 6 months and subsequent
group-level change was small. That late average stability did not imply
individual stability: responder-state transitions remained common.
Preoperative hemoglobin showed no evidence of modifying the shape of
longitudinal ODI recovery after covariate adjustment. Preserving
repeated follow-up times reveals information that is lost when
postoperative measurements are collapsed into a single LOCF
endpoint.
Keywords: spine surgery; Oswestry Disability Index; longitudinal analysis; patient-reported outcomes; recovery trajectory; secondary data analysis; missing data; hemoglobin
Introduction
Evaluation of spine surgery has moved beyond technical or radiographic success toward outcomes that capture whether patients actually function better in daily life. Patient-reported outcome measures (PROMs) are therefore central to contemporary spine outcomes research because they quantify pain, function, disability, and health status from the patient perspective [1]. The Oswestry Disability Index (ODI) is among the most widely used spine-specific PROMs and provides a standardized 0-100 measure of disability, with higher scores indicating greater limitation [2]. In both clinical studies and registries, however, ODI is frequently summarized as change from baseline at a single postoperative visit or as achievement of a prespecified improvement threshold. Those summaries are clinically useful, but they reduce recovery to an endpoint. They do not identify when improvement occurred, whether gains were sustained, or whether apparently similar long-term outcomes arose through different postoperative courses.
Time is therefore part of the outcome rather than merely the schedule on which the outcome is recorded. A patient who improves rapidly and then remains stable, a patient who improves slowly, and a patient who improves initially but later deteriorates may have the same ODI at 12 or 24 months while representing very different recovery experiences and follow-up needs. Longitudinal spine-surgery cohorts generally indicate that average improvement is front-loaded, with the largest gains occurring during the first postoperative months or year and smaller mean changes thereafter [3-6]. Yet population averages are only one level of the recovery process. Multilevel and trajectory analyses in adult symptomatic lumbar scoliosis, lumbar spinal stenosis, lumbar discectomy, and lumbar fusion have demonstrated substantial between-patient heterogeneity in the rate, magnitude, and pattern of postoperative recovery [7-10]. A stable group mean can therefore coexist with clinically relevant improvement in some patients and deterioration in others. Distinguishing mean trajectory from within-person state change is essential when the objective is to characterize recovery rather than simply report a final score.
This distinction is particularly important in registry-based studies, where follow-up is often incomplete and nonmonotone. Collapsing observations obtained at different postoperative times into one composite long-term endpoint can be appropriate for a specific prognostic question, but it necessarily changes the estimand: the analysis no longer describes disability at defined follow-up times or the shape of recovery between them. The SPINEREG cohort offers a useful example. The source study included 1,392 adults undergoing noncervical spine surgery and examined long-term recovery from disability in relation to hemoglobin and other clinical variables [11]. To obtain a complete long-term outcome, ODI values recorded at 24, 12, or 6 months were hierarchically combined using last observation carried forward (LOCF) into a single outcome described as the 17-month ODI [11]. That strategy addressed the original prediction objective, but it made measurements obtained at materially different postoperative times contribute to one endpoint and could not describe nonmonotone individual courses. The subsequent release of the raw SPINEREG Version 2 dataset under an open license [12] made it possible to ask a distinct, time-resolved question without recollecting data or altering the original study conclusions.
We therefore performed a prespecified secondary longitudinal analysis that retained the recorded assessment times. The primary objective was to estimate the population-average course of ODI from the preoperative assessment through 6, 12, and 24 months and to determine how much of the observed 24-month improvement was already present by 6 months. Secondary objectives were to test whether preoperative hemoglobin or diagnostic group modified the postoperative trajectory, quantify the proportion of patients meeting relative and absolute ODI response criteria at each follow-up, characterize within-person transitions between responder and nonresponder states, and evaluate the robustness of the time-course findings to alternative correlation structures and incomplete follow-up. We hypothesized that average disability improvement would be concentrated in the first 6 months, whereas later stability of the group mean would not necessarily imply stability of individual patient response.
Methods
Study design and data source
This was a secondary longitudinal analysis of the publicly released SPINEREG dataset associated with Briguglio et al. [11,12]. The registry was established at IRCCS Orthopedic Institute Galeazzi, Milan, Italy. The source extraction included adults enrolled between 2016 and 2019 who underwent spine surgery and had at least one ODI assessment at 6, 12, or 24 months; patients with tumors, admissions for complications, cervical procedures, or preoperative ODI below 12.7 were excluded [11]. Version 2 of the dataset is publicly available from Mendeley Data under a CC BY 4.0 license [12]. Reporting followed STROBE and the RECORD extension where applicable to this secondary analysis [13,14].
The public workbook contained 1,392 patient rows and no explicit patient identifier. A deterministic analysis-only record identifier was therefore generated from workbook row order while the source file was retained unchanged. The statistical analysis plan (SAP) was frozen on 10 October 2026 after data-integrity checks and implementation-feasibility testing and before definitive inferential interpretation. The analysis was not prospectively preregistered; this timing is reported explicitly to distinguish the frozen analysis hierarchy from prospective registration.
Ethics and secondary use
The source publication reports that ethical review and approval and written informed consent were not required under applicable local legislation and institutional requirements [11]. The present secondary analysis used only the publicly released dataset, which contains no direct participant identifiers, and involved no participant contact or new data collection.
Variables and outcomes
The primary outcome was ODI measured preoperatively and at 6, 12, and 24 months. Available baseline variables included sex, age, red blood cell count, hematocrit, hemoglobin (Hb), mean corpuscular volume, mean corpuscular hemoglobin, mean corpuscular hemoglobin concentration, C-reactive protein, American Society of Anesthesiologists (ASA) physical status, operative time, length of stay, and diagnosis. Diagnosis codes were mapped as in the source article: spinal deformity (kyphosis or scoliosis), disc disease, and other back surgery (spondylosis, spondylolisthesis, stenosis, or elective fracture treatment) [11].
Two response definitions were prespecified and recalculated directly from the raw ODI values at each observed follow-up. Relative response was defined as at least 30% improvement from baseline, a threshold supported by international consensus and large spine-registry analyses [15,16]. Absolute response was defined as at least 12.7 ODI points, matching the source SPINEREG analysis and closely approximating the 12.8-point threshold reported by Copay et al. [17]. These thresholds were used as clinically interpretable classification rules rather than as proof that every threshold crossing represented an identical patient-perceived benefit.
Missing data
No LOCF or other single-value outcome imputation was used in the primary longitudinal analysis. All observed ODI measurements contributed to the mixed model under a missing-at-random interpretation conditional on the modeled data structure. Follow-up availability at 6, 12, and 24 months was examined in separate logistic models including baseline ODI, Hb, age, sex, diagnosis, and ASA. Because attrition can bias estimates from spine registries and may be related to patient characteristics or outcomes [18,19], robustness was assessed using Gaussian GEE with exchangeable working correlation and robust standard errors, complete longitudinal cases, and inverse-probability-weighted (IPW) GEE based on stabilized visit-specific follow-up probabilities. IPW weights were truncated at the 1st and 99th percentiles.
Statistical analysis
The primary model was a linear mixed-effects regression with ODI as the repeated outcome, categorical time (preoperative, 6, 12, and 24 months) as the fixed effect, and a participant-specific random intercept. Maximum-likelihood estimation was used. Model-estimated mean ODI and 95% confidence intervals (CIs) were obtained at each assessment. Prespecified contrasts compared each postoperative assessment with baseline and compared 12 versus 6, 24 versus 12, and 24 versus 6 months. The three postoperative interval contrasts formed one multiplicity family and were adjusted using the Holm method. Because the cohort had no nonsurgical comparator, these contrasts describe longitudinal change among surgical patients and are not causal estimates of the effect of surgery.
The prespecified Hb model was restricted to postoperative ODI and included categorical time (6 months as reference), baseline ODI, Hb, Hb×time, age, sex, diagnosis, and ASA, with a participant-specific random intercept. The primary Hb test was a joint 2-degree-of-freedom Wald test of the Hb×time terms; time-specific estimates were expressed as ODI points per 1 g/dL higher preoperative Hb. A parallel postoperative mixed model tested diagnosis×time while adjusting for baseline ODI, Hb, age, sex, and ASA, with disc disease as the reference diagnosis and a 4-degree-of-freedom global interaction test. For visualization, diagnosis-specific adjusted means were standardized over the cohort covariate distribution; diagnostic contrasts were derived directly from the fitted model.
Responder proportions were calculated among participants observed at each follow-up with Wilson 95% CIs. Among complete longitudinal cases, all eight possible binary responder sequences across 6, 12, and 24 months were enumerated without assigning biological subtype labels. Direct paired postoperative changes were also calculated for patients observed at both relevant time points. Model convergence and residual behavior were inspected, and GEE analyses provided a robust-standard-error sensitivity check. All tests were two-sided with alpha=0.05; effect estimates and 95% CIs were emphasized. Analyses were implemented in Python 3.13.5 using NumPy 2.3.5, pandas 2.2.3, SciPy 1.17.0, statsmodels 0.14.6, and Matplotlib 3.10.8. Detailed supporting analyses are provided in Supplementary File S1 (Tables S1-S8), and the executable analysis workflow is provided in Supplementary File S2 - Reproducibility Package.
Results
Cohort and follow-up
The released cohort included 1,392 patients (mean age 56.4±15.2 years), of whom 825 (59.3%) were women. Mean preoperative ODI was 46.84±16.40 and mean Hb was 14.04±1.38 g/dL. Diagnostic groups comprised 216 patients (15.5%) with spinal deformity, 628 (45.1%) with disc disease, and 548 (39.4%) undergoing other back surgery. ODI was observed in 837 patients (60.1%) at 6 months, 970 (69.7%) at 12 months, and 661 (47.5%) at 24 months; 254 patients (18.2%) had ODI available at all three postoperative follow-ups (Table 1).
Table 1. Cohort characteristics and follow-up availability.
| Participants |
1,392 |
| Age, years |
56.4 ± 15.2 |
| Women |
825 (59.3%) |
| Men |
567 (40.7%) |
| Preoperative Hb, g/dL |
14.04 ± 1.38 |
| Preoperative ODI |
46.84 ± 16.40 |
| ASA physical status |
1.86 ± 0.57 |
| ASA 1 / 2 / 3 |
338 (24.3%) / 907 (65.2%) / 147 (10.6%) |
| Operative time, min |
220.01 ± 142.28; n=1,378 |
| Length of stay, days |
4.83 ± 3.61 |
| Spinal deformity |
216 (15.5%) |
| Disc disease |
628 (45.1%) |
| Other back surgery |
548 (39.4%) |
| ODI observed at 6 months |
837 (60.1%) |
| ODI observed at 12 months |
970 (69.7%) |
| ODI observed at 24 months |
661 (47.5%) |
| Complete 6-, 12-, and 24-month ODI |
254 (18.2%) |
Note. Values are mean ± SD or n (%). Hb, hemoglobin; ODI, Oswestry Disability Index; ASA, American Society of Anesthesiologists physical status.
Primary longitudinal course
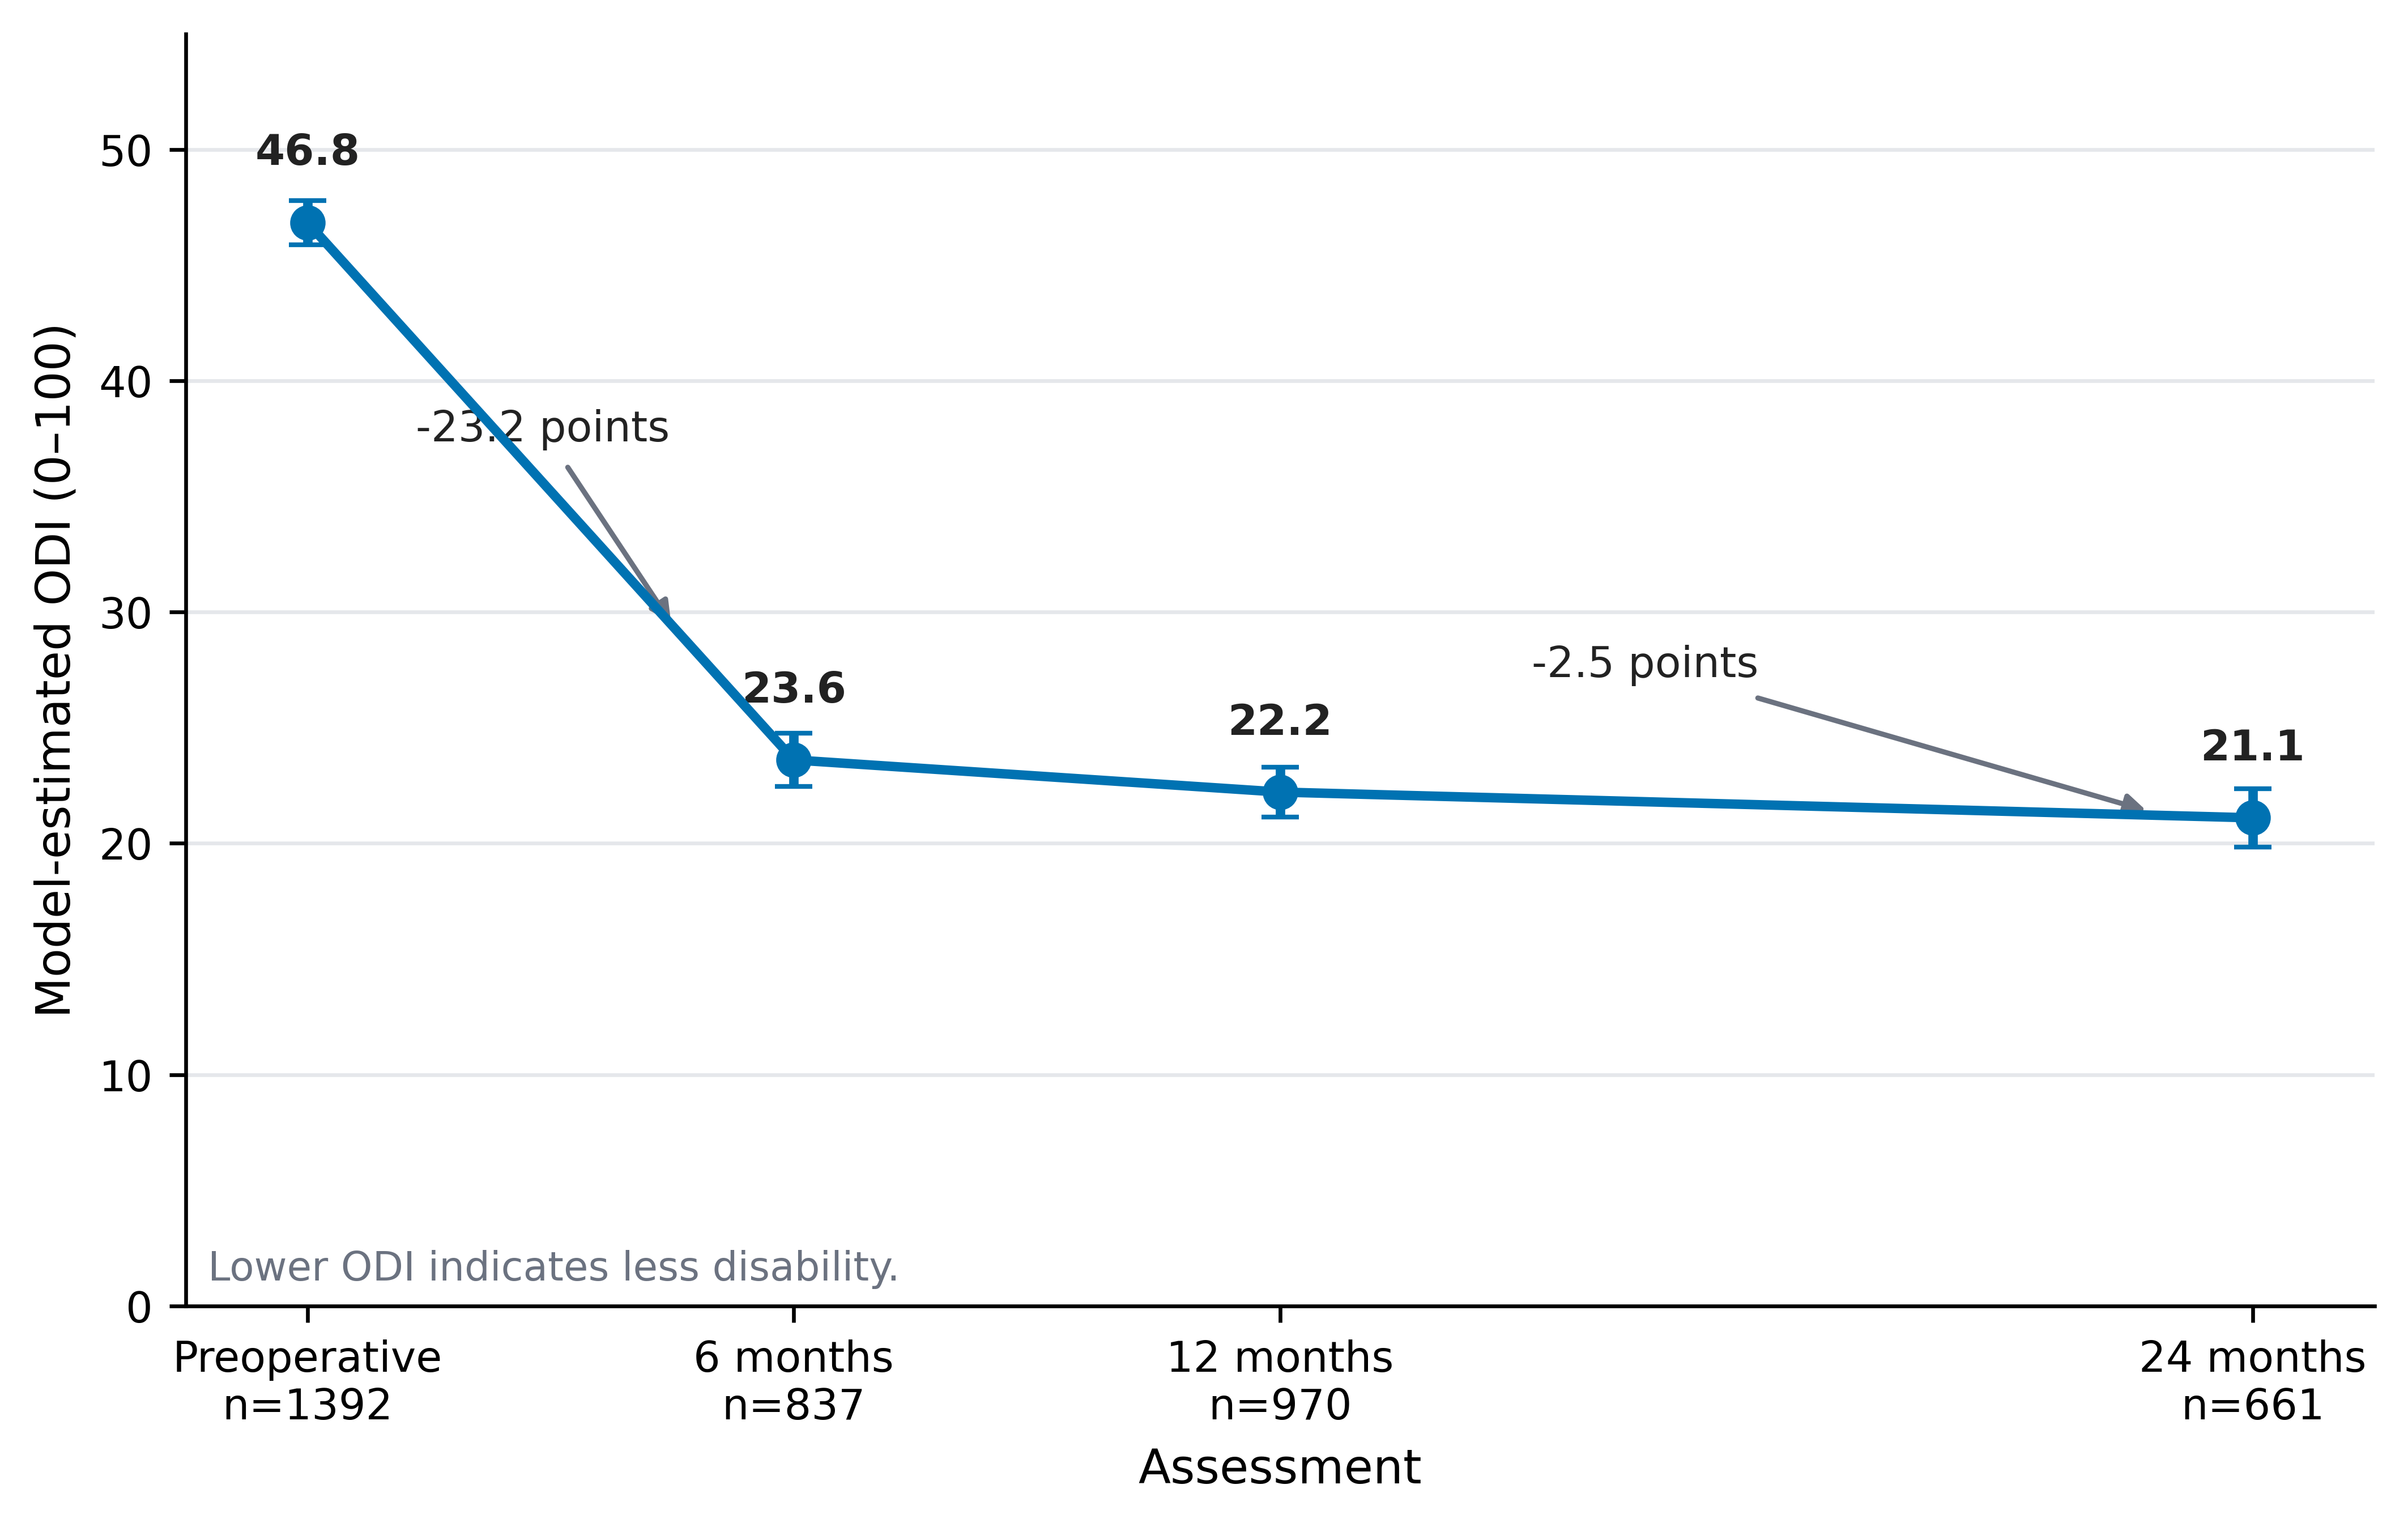
The primary mixed-effects model converged. Model-estimated ODI decreased from 46.84 (95% CI 45.89-47.79) preoperatively to 23.61 (22.46-24.75) at 6 months, 22.22 (21.13-23.30) at 12 months, and 21.10 (19.84-22.36) at 24 months (Figure 1; Table 2). Relative to baseline, the estimated reductions were 23.23 points at 6 months, 24.62 points at 12 months, and 25.74 points at 24 months (all p<0.001). Descriptively, 90.3% of the model-estimated baseline-to-24-month reduction was already present at 6 months.
Average postoperative change after 6 months was small. ODI decreased by 1.39 points from 6 to 12 months (95% CI -2.66 to -0.12; raw p=0.032; Holm-adjusted p=0.064), by 1.11 points from 12 to 24 months (95% CI -2.51 to 0.28; p=0.117), and by 2.50 points from 6 to 24 months (95% CI -3.94 to -1.06; raw p<0.001; Holm-adjusted p=0.002). Thus, the statistically detectable 6-to-24-month mean difference was substantially smaller than commonly used individual ODI improvement thresholds [15-17].
Observed-case ODI means were close to the corresponding primary-model estimates, but they were not treated as unbiased longitudinal estimates because follow-up availability varied across time (Supplementary Table S1).
Figure 1. Primary longitudinal ODI trajectory. Points are mixed-model estimated means and error bars are 95% confidence intervals. Numbers below each assessment indicate the observed ODI measurements contributing at that time point. The annotations show the estimated preoperative-to-6-month and 6-to-24-month changes; lower ODI indicates less disability.
Table 2. Primary mixed-effects model estimates and prespecified time contrasts.
| PRE |
46.84 |
45.89 to 47.79 |
Estimated mean |
| 6 months |
23.61 |
22.46 to 24.75 |
Estimated mean |
| 12 months |
22.22 |
21.13 to 23.30 |
Estimated mean |
| 24 months |
21.10 |
19.84 to 22.36 |
Estimated mean |
| 6 vs PRE |
-23.23 |
-24.39 to -22.08 |
<0.001 |
| 12 vs PRE |
-24.62 |
-25.72 to -23.53 |
<0.001 |
| 24 vs PRE |
-25.74 |
-27.01 to -24.47 |
<0.001 |
| 12 vs 6 |
-1.39 |
-2.66 to -0.12 |
0.032 (Holm 0.064) |
| 24 vs 12 |
-1.11 |
-2.51 to 0.28 |
0.117 (Holm 0.117) |
| 24 vs 6 |
-2.50 |
-3.94 to -1.06 |
<0.001 (Holm 0.002) |
Note. Negative contrasts indicate lower disability at the later assessment. Holm adjustment was prespecified for the three postoperative interval contrasts only. Baseline-to-postoperative contrasts are descriptive within-cohort changes, not causal treatment effects.
Sensitivity analyses
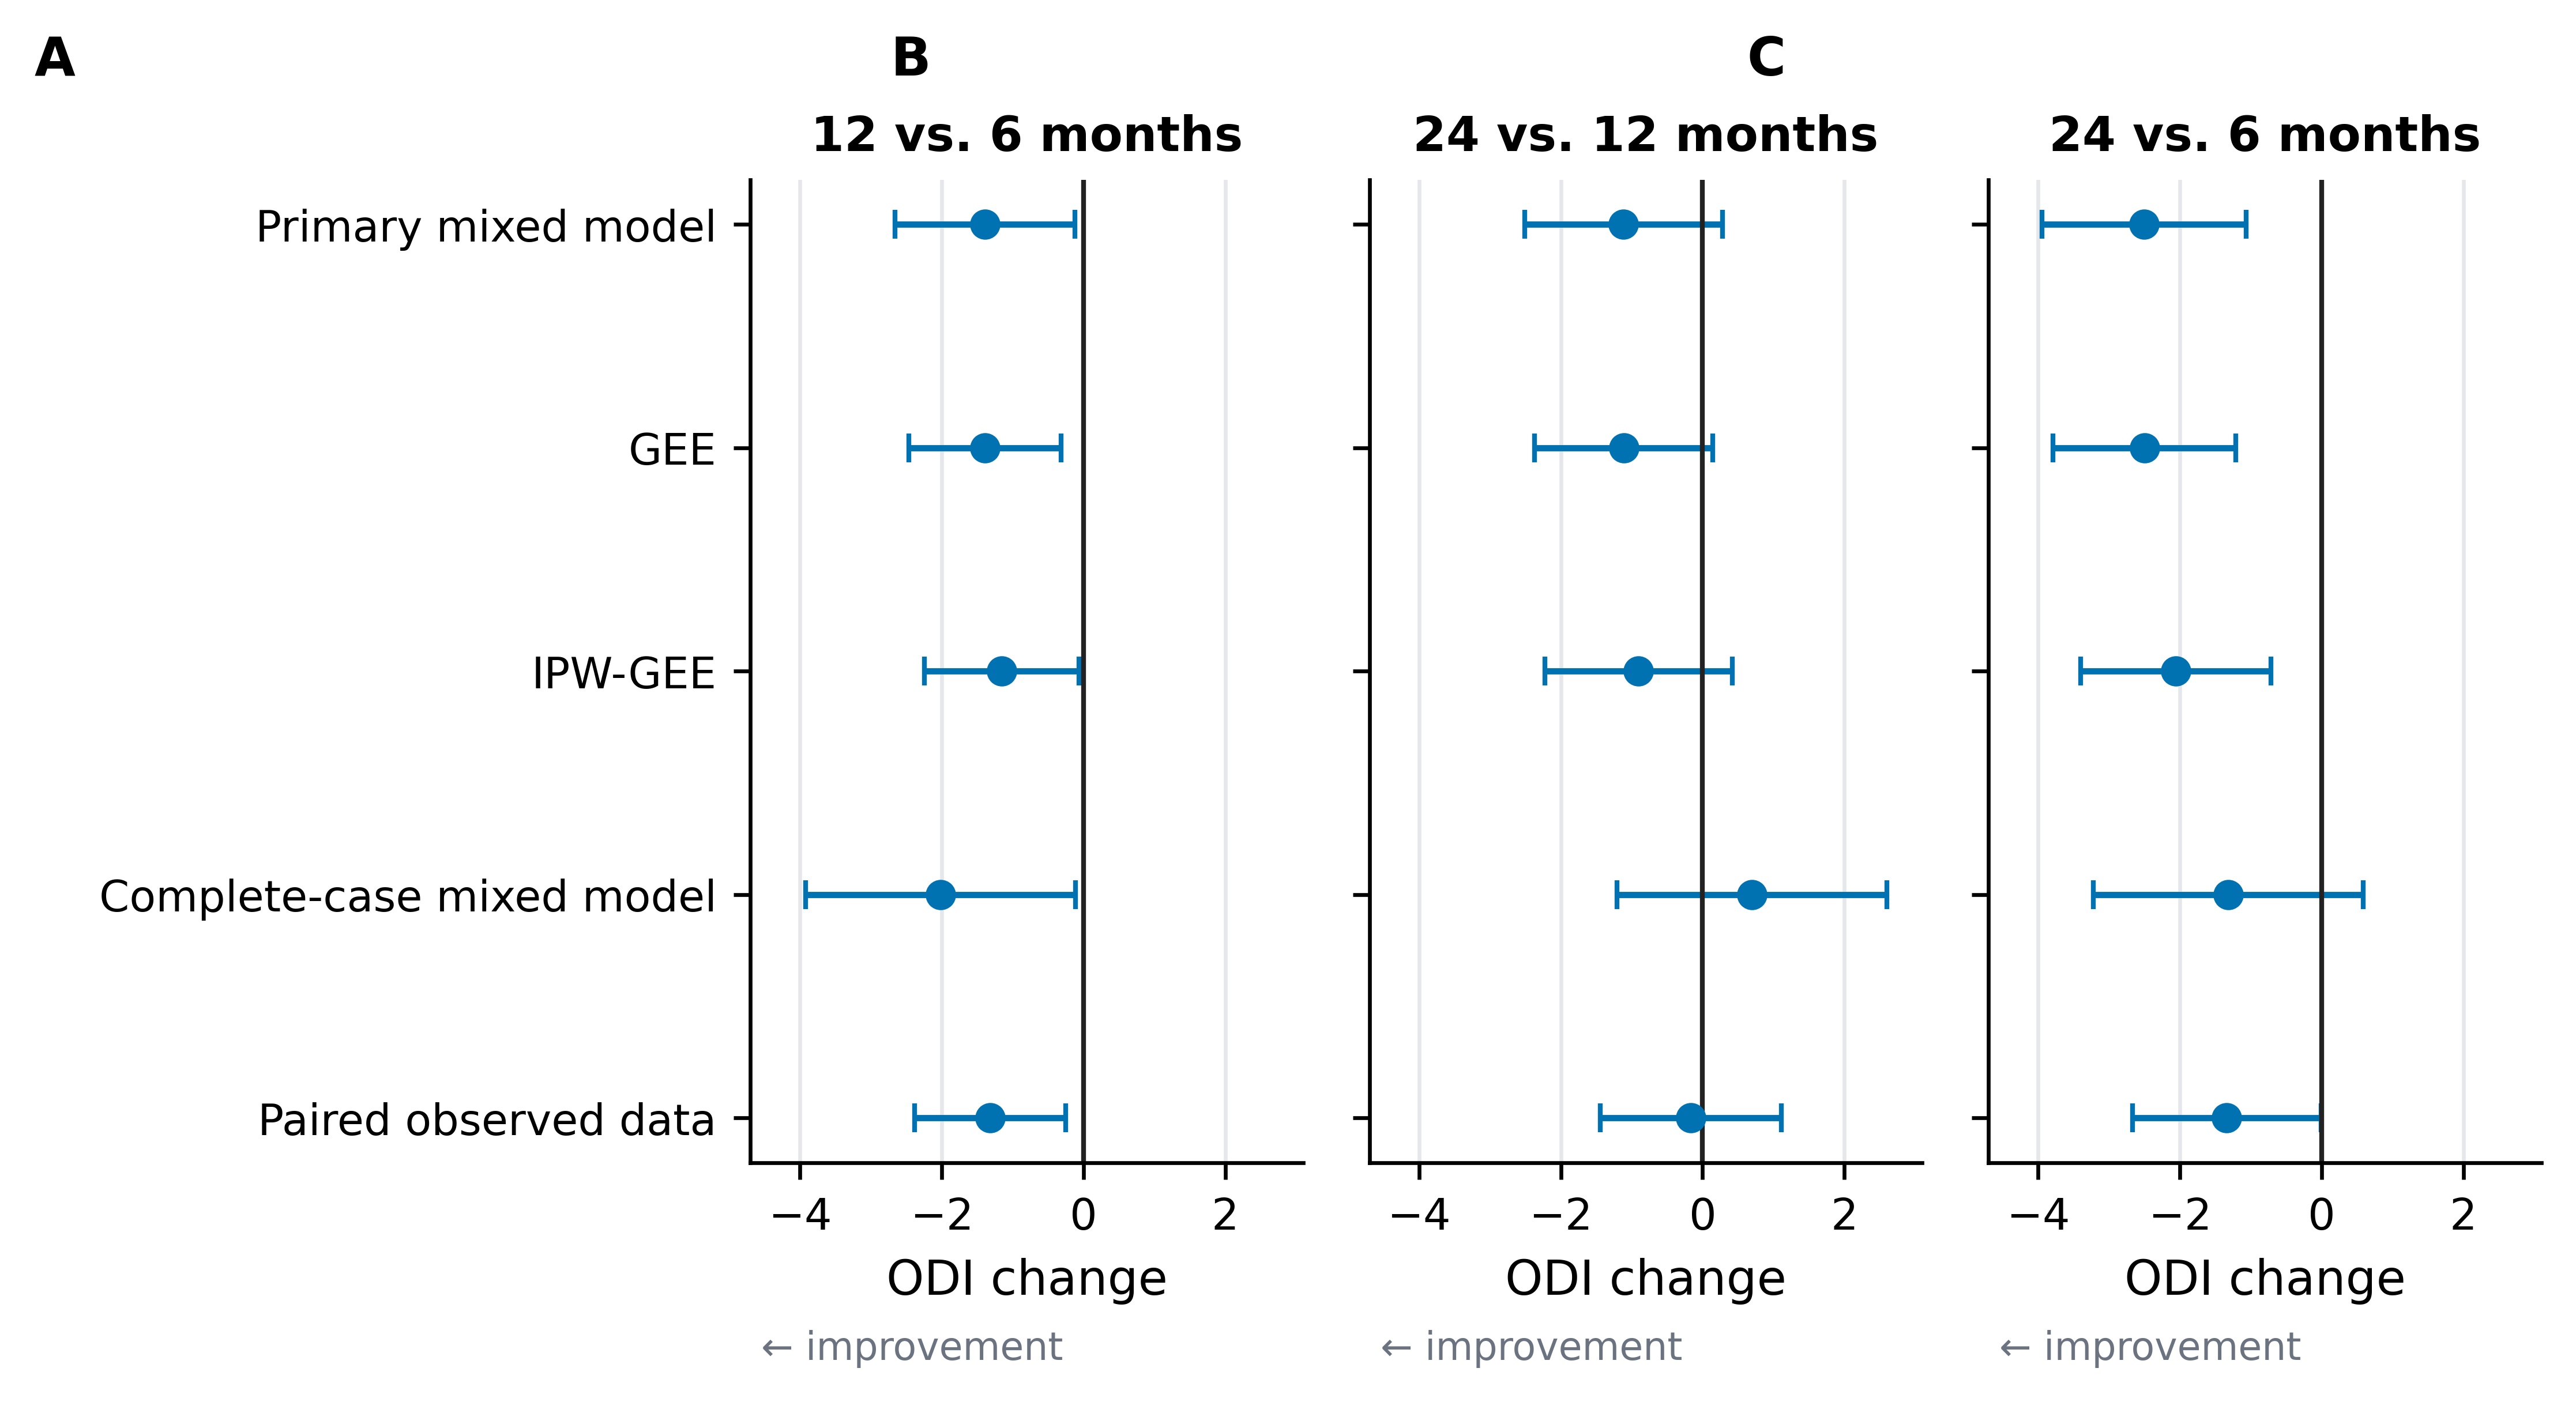
GEE, IPW-GEE, complete-case mixed models, and direct paired comparisons all retained the same qualitative pattern of small average changes after 6 months (Figure 2; Supplementary Tables S2, S3, S5, and S7). In IPW-GEE, ODI changed by -1.15 points from 6 to 12 months (95% CI -2.25 to -0.06), -0.90 from 12 to 24 months (-2.22 to 0.42), and -2.06 from 6 to 24 months (-3.40 to -0.71). Among 254 complete cases, estimated ODI was 19.57 at 6 months, 17.55 at 12 months, and 18.25 at 24 months; the 12-to-24-month change was +0.70 points (95% CI -1.20 to 2.60). Paired observed changes were likewise small. No sensitivity approach suggested a large late average improvement.
Figure 2. Robustness of late postoperative ODI changes across analytic approaches. Points and horizontal lines show estimated mean changes and nominal 95% confidence intervals for 12 versus 6 months (A), 24 versus 12 months (B), and 24 versus 6 months (C). Negative values indicate improvement. GEE, generalized estimating equations; IPW-GEE, inverse-probability-weighted GEE. The primary-model Holm-adjusted p values are reported in Table 2; confidence intervals are not multiplicity-adjusted.
Diagnosis and postoperative disability
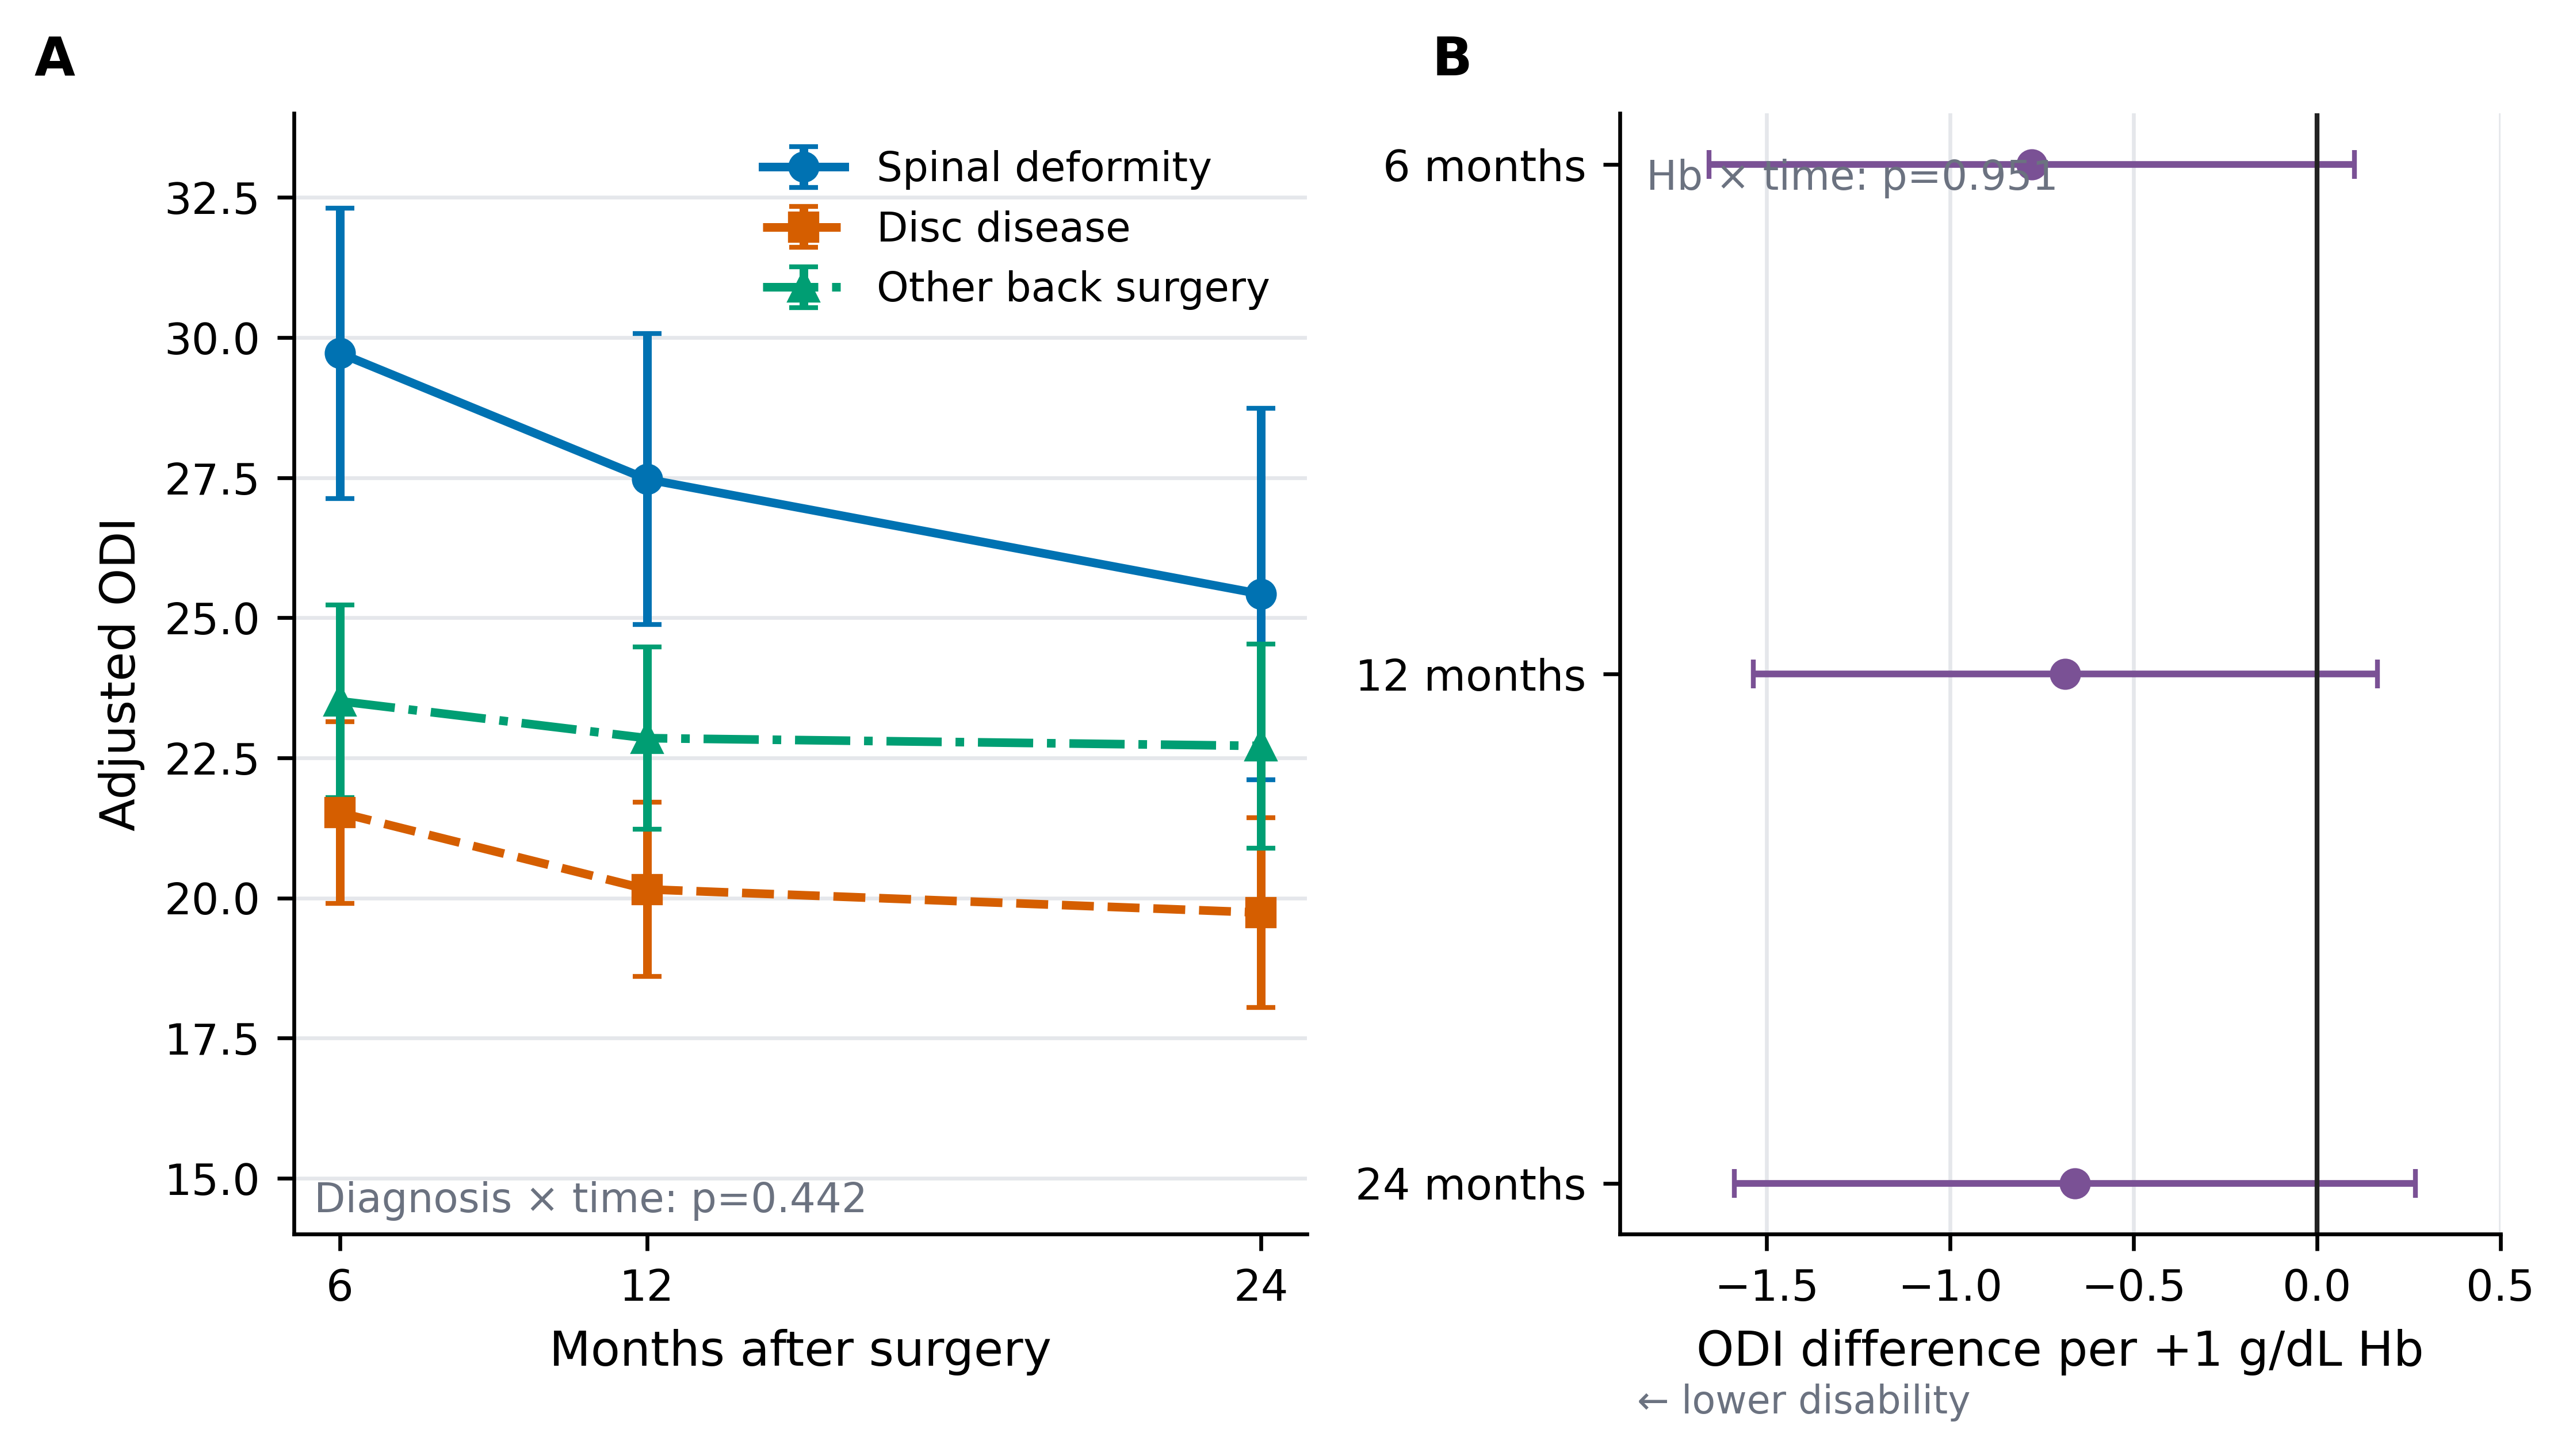
The global diagnosis×time interaction was not significant (χ²=3.74, 4 df, p=0.442), providing no clear evidence that the shape of postoperative change differed across diagnostic groups. Adjusted disability levels nevertheless differed. Compared with disc disease, spinal deformity was associated with ODI higher by 8.20 points at 6 months (95% CI 5.12 to 11.28), 7.32 points at 12 months (4.27 to 10.37), and 5.68 points at 24 months (1.95 to 9.42). Other back surgery differed less from disc disease: +1.99, +2.70, and +2.97 points at 6, 12, and 24 months, respectively (Figure 3A; Table 3). The standardized diagnosis-specific trajectories underlying Figure 3A are provided in Supplementary Table S8.
Hemoglobin and recovery trajectory
There was no evidence that preoperative Hb modified the postoperative time course after adjustment for baseline ODI, age, sex, diagnosis, and ASA (joint Hb×time χ²=0.10, 2 df, p=0.951). Each 1 g/dL higher Hb was associated with -0.78 ODI points at 6 months (95% CI -1.66 to 0.10; p=0.083), -0.69 at 12 months (-1.54 to 0.16; p=0.114), and -0.66 at 24 months (-1.59 to 0.27; p=0.164) (Figure 3B; Table 3). The direction was similar at all assessments, but all CIs crossed zero.
Figure 3. Secondary recovery modifiers. (A) Covariate-adjusted postoperative ODI trajectories by diagnostic group, standardized over the cohort covariate distribution; error bars are 95% confidence intervals. The diagnosis×time interaction was not significant (p=0.442). (B) Adjusted ODI difference per 1 g/dL higher preoperative hemoglobin at each follow-up; negative estimates indicate lower disability. The Hb×time interaction was not significant (p=0.951).
Clinical responder states
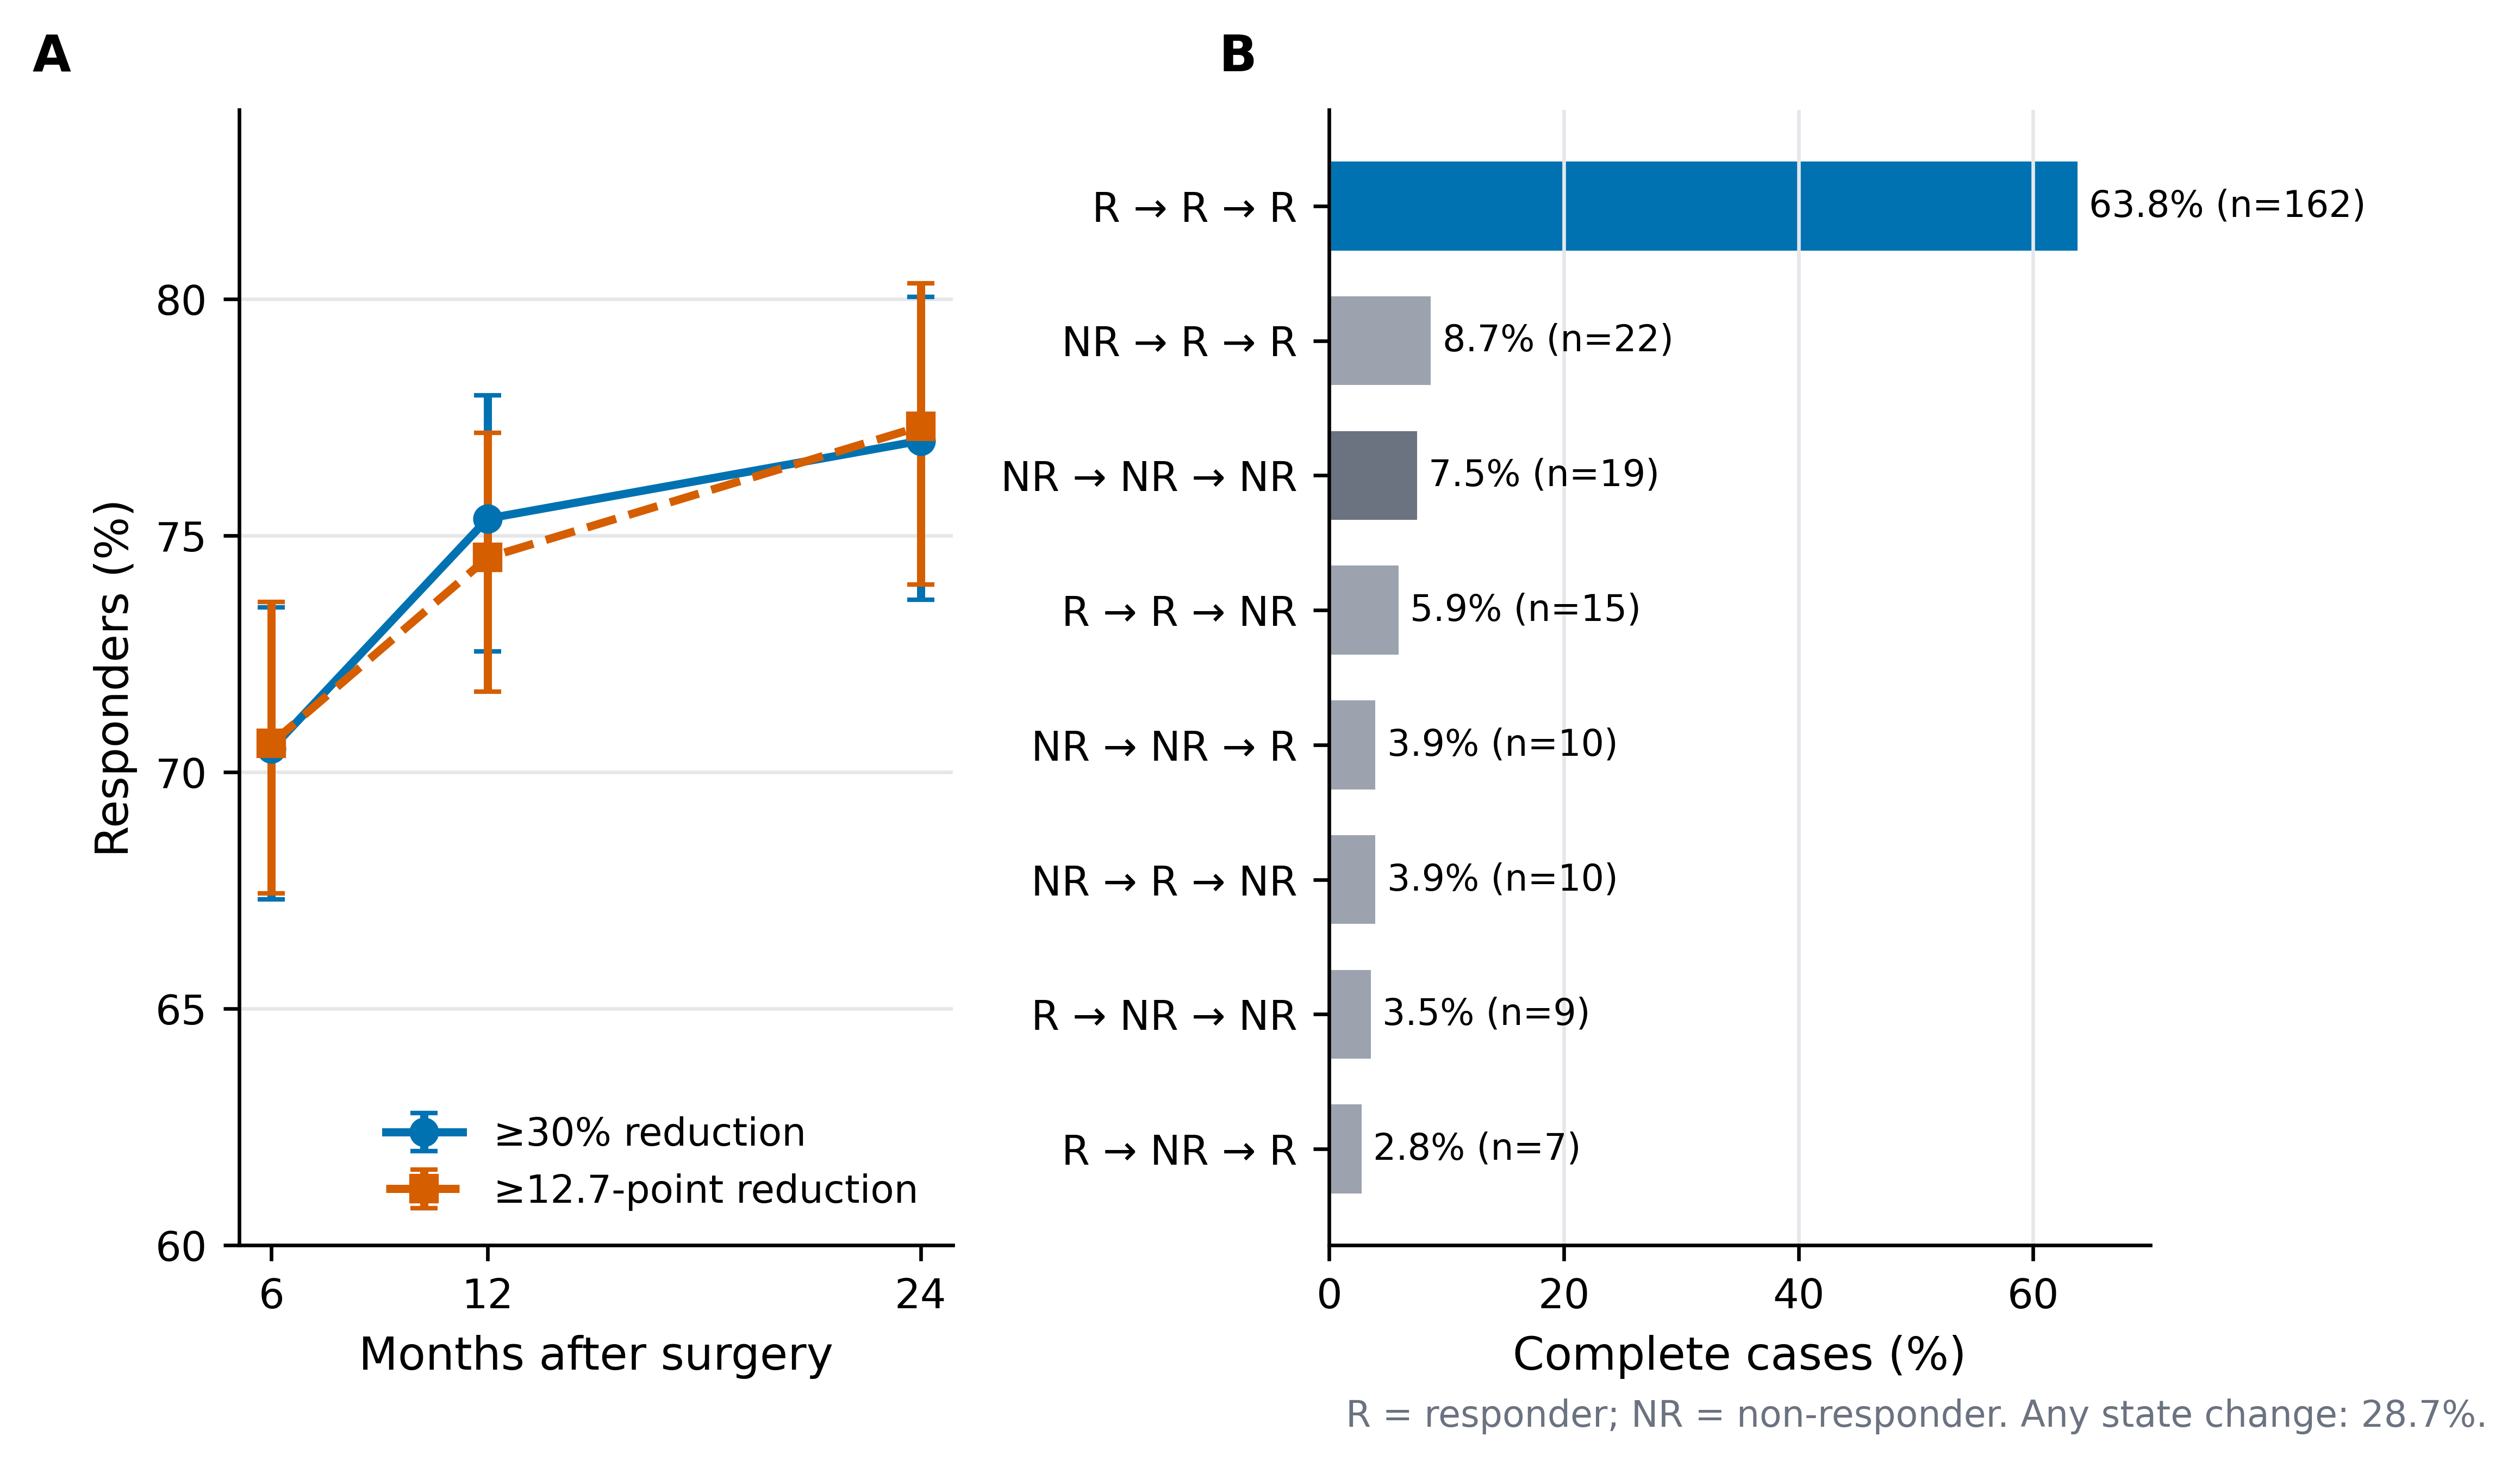
Using the at least 30% improvement definition, 590/837 (70.5%) observed patients were responders at 6 months, 731/970 (75.4%) at 12 months, and 509/661 (77.0%) at 24 months. The 12.7-point definition yielded nearly identical proportions: 70.6%, 74.5%, and 77.3%, respectively (Figure 4A; Table 4). The similarity of the aggregate proportions did not imply identical patient classifications at every visit.
Among the 254 complete longitudinal cases, 162 (63.8%) met the 30% response threshold at all three visits and 19 (7.5%) never met it. The remaining 73 patients (28.7%) changed responder state at least once between 6, 12, and 24 months (Figure 4B; Supplementary Table S6). Thus, a comparatively stable group-average trajectory after 6 months coexisted with clinically relevant within-person movement across the responder threshold.
Figure 4. Threshold-defined ODI response and responder-state heterogeneity. (A) Observed responder proportions with Wilson 95% confidence intervals using at least 30% relative improvement and at least 12.7-point absolute improvement; denominators vary by follow-up availability. (B) Distribution of 6→12→24-month responder sequences among the 254 complete cases for the 30% definition. R, responder; NR, non-responder.
Follow-up missingness
Follow-up availability was associated with selected baseline characteristics. Older age was associated with slightly lower odds of observation at 6 months (OR 0.991 per year; p=0.047) and 24 months (OR 0.982; p<0.001). Relative to disc disease, spinal deformity was associated with greater odds of 6-month observation (OR 1.77; p=0.001) but lower odds of 24-month observation (OR 0.49; p<0.001); no prespecified baseline predictor reached p<0.05 for 12-month availability. Full coefficients for the follow-up-availability models are reported in Supplementary Table S4. Stabilized IPW weights were modest after truncation (1st-99th percentile, 0.77-1.44), but neither weighting nor complete-case analysis can rule out bias from unmeasured determinants of missingness or missing-not-at-random mechanisms.
Table 3. Adjusted hemoglobin and diagnosis associations with postoperative ODI.
| Hb per +1 g/dL at 6 months |
-0.78 |
-1.66 to 0.10 |
0.083 |
| Hb per +1 g/dL at 12 months |
-0.69 |
-1.54 to 0.16 |
0.114 |
| Hb per +1 g/dL at 24 months |
-0.66 |
-1.59 to 0.27 |
0.164 |
| Deformity vs disc at 6 months |
8.20 |
5.12 to 11.28 |
<0.001 |
| Other back vs disc at 6 months |
1.99 |
-0.42 to 4.40 |
0.106 |
| Deformity vs disc at 12 months |
7.32 |
4.27 to 10.37 |
<0.001 |
| Other back vs disc at 12 months |
2.70 |
0.41 to 4.99 |
0.021 |
| Deformity vs disc at 24 months |
5.68 |
1.95 to 9.42 |
0.003 |
| Other back vs disc at 24 months |
2.97 |
0.44 to 5.50 |
0.021 |
Note. Hb model: joint Hb×time p=0.951. Diagnosis model: global diagnosis×time p=0.442. Models adjust for baseline ODI and prespecified covariates as described in Methods. Diagnosis contrasts are model-based differences and are unaffected by the standardization used to display Figure 3A.
Table 4. Threshold-defined ODI response at each observed follow-up.
| 6 months |
≥30% reduction |
590/837 |
70.5% |
67.3% to 73.5% |
| 6 months |
≥12.7-point reduction |
591/837 |
70.6% |
67.4% to 73.6% |
| 12 months |
≥30% reduction |
731/970 |
75.4% |
72.6% to 78.0% |
| 12 months |
≥12.7-point reduction |
723/970 |
74.5% |
71.7% to 77.2% |
| 24 months |
≥30% reduction |
509/661 |
77.0% |
73.6% to 80.1% |
| 24 months |
≥12.7-point reduction |
511/661 |
77.3% |
74.0% to 80.3% |
Note. Responder status was recalculated directly from raw ODI values at each observed follow-up. Denominators differ because of incomplete follow-up; percentages at different visits therefore should not be interpreted as transitions in the same individuals.
Discussion
This time-resolved secondary analysis changes the unit of inquiry from a single LOCF-defined long-term endpoint to the sequence of recorded ODI assessments. The principal finding was a dissociation between the population-average trajectory and individual response stability. Approximately 90% of the model-estimated baseline-to-24-month ODI reduction was already present at 6 months, after which the mean changed only modestly. At the same time, 28.7% of complete cases changed 30% responder status at least once between postoperative assessments. Preoperative hemoglobin did not modify the shape of the longitudinal ODI trajectory after covariate adjustment, and diagnosis was associated with postoperative disability burden but not with a statistically distinguishable time course. These results indicate that the timing and level of recovery represent related but noninterchangeable features of postoperative outcome.
The concentration of average improvement in the early postoperative period is consistent with prior longitudinal work. Studies of adult spinal deformity have shown substantial improvement by 6-12 months with smaller subsequent gains [3,5], while a large thoracolumbar registry similarly found that patient-rated outcomes changed most during the earlier phase of follow-up before largely leveling off [4]. Azam et al. reported little additional ODI change after 6 months through 3 years in an adult spinal deformity cohort [6]. In SPINEREG, the adjusted difference between 6 and 24 months was only 2.50 ODI points. This late change was statistically detectable in some analyses but small in magnitude relative to commonly used individual improvement thresholds [15-17]. That comparison should be interpreted cautiously: a mean change in a cohort and a minimal important change defined for an individual are different estimands. The value of the comparison is therefore contextual rather than a basis for declaring the late interval clinically irrelevant.
The individual-level analysis adds information that is not visible from the mean curve. Prior work has identified distinct postoperative disability trajectories after surgery for adult symptomatic lumbar scoliosis, lumbar spinal stenosis, lumbar radiculopathy, and lumbar fusion [7-10]. SPINEREG was not designed here for latent-class discovery, and we deliberately avoided assigning patients to data-driven phenotypes because that was not prespecified, follow-up was incomplete, and the public dataset lacks several variables needed to interpret such classes. Instead, responder status was used as a transparent descriptive state. The fact that almost three in ten complete cases crossed the 30% threshold at least once demonstrates that a near-flat late mean can arise despite meaningful within-person movement. These transitions should not be interpreted as biologically discrete recovery phenotypes: some will reflect true clinical change, some measurement variability, and some movement around an arbitrary cut point. Their importance is methodological-they show why a single endpoint cannot establish that an individual’s postoperative course was stable.
The hemoglobin results refine, rather than contradict, the original SPINEREG analysis. Briguglio et al. reported that higher preoperative hemoglobin contributed to models predicting a LOCF-defined long-term recovery outcome [11]. The present analysis addresses a different question: whether hemoglobin is associated with the shape of disability recovery across observed postoperative times after adjustment for baseline ODI and clinical covariates. The hemoglobin-by-time interaction was essentially null, and the estimated hemoglobin associations at individual follow-ups were small with confidence intervals spanning zero. Thus, the data do not support preoperative hemoglobin as a modifier of the 6- to 24-month ODI trajectory. This does not exclude other clinically relevant roles of hemoglobin in perioperative physiology, transfusion requirements, complications, or outcomes not captured in the public dataset, nor does it invalidate its contribution to the original prognostic model.
Diagnostic group showed a different pattern. Patients undergoing surgery for spinal deformity had persistently higher adjusted postoperative ODI than those with disc disease, but the diagnosis-by-time interaction was not significant. The most parsimonious interpretation is therefore a difference in postoperative disability level rather than evidence of distinctly shaped recovery curves over the measured intervals. This distinction matters because higher residual disability does not necessarily imply slower recovery. Mechanistic interpretation is limited by the variables available in the released dataset: surgical levels, fusion extent, alignment correction, complications, reoperations, rehabilitation exposure, pain trajectories, and other procedure-specific factors were not available to explain the observed between-group differences.
Incomplete follow-up is the main threat to inference. Only 47.5% of the cohort had a 24-month ODI and 18.2% contributed all three postoperative assessments, and observation at selected visits was associated with baseline age and diagnosis. The missingness process is therefore unlikely to be purely random. Registry studies in spine surgery have reached different conclusions about the consequences of attrition: some have found limited material bias under moderate loss to follow-up [19], whereas a registry analysis of more than 15,000 patients found worse early outcomes among later nonresponders and cautioned that attrition may overestimate treatment success [18]. In the present study, mixed-effects models, conventional GEE, inverse-probability-weighted GEE, complete-case analyses, and direct paired comparisons all reproduced the same broad pattern of large early improvement and small later mean change. Convergence across methods strengthens confidence in that pattern, but it cannot rule out bias from unmeasured determinants of follow-up or missing-not-at-random mechanisms.
The findings also clarify what a 6-month assessment can and cannot provide. At the group level, 6-month ODI captured most of the average improvement observed through 24 months, making it a highly informative benchmark for population-level recovery in this cohort. This accords with recent lumbar decompression data in which observed 6-month ODI showed strong concordance with 12-month disability, while a minority of patients nevertheless experienced clinically relevant later deterioration [20]. The implication is not that later follow-up is unnecessary. Rather, follow-up timing should match the question: 6 months may efficiently summarize average recovery for some research or quality-assurance purposes, whereas later assessment remains important for identifying individual deterioration, delayed benefit, reoperation, complications, and outcomes outside the ODI domain. Analytically, preserving repeated measurements retains this distinction; collapsing 6-, 12-, and 24-month observations into one LOCF endpoint does not.
This study has several strengths: a large openly released cohort, direct reanalysis of the source data, retention of the recorded follow-up times, prespecified primary and sensitivity analyses, explicit responder definitions, and reproducible code and machine-readable outputs. The limitations are equally important. The registry is observational and diagnostically heterogeneous, procedures were incompletely characterized, follow-up was substantially and nonmonotonically missing, and the public file contained no explicit patient identifier. The cohort also required baseline ODI of at least 12.7 and at least one postoperative assessment, which limits generalizability to patients with minimal baseline disability or no recorded follow-up. ODI is bounded and not perfectly Gaussian, although the large sample and agreement with GEE-based analyses reduce dependence on a single distributional specification. The analysis plan was frozen after data-quality and implementation checks rather than prospectively preregistered. Finally, in the absence of a nonsurgical comparator, preoperative-to-postoperative change describes the course of operated patients and should not be interpreted as a causal effect of surgery.
Conclusion
In this time-resolved secondary analysis of SPINEREG, disability recovery after noncervical spine surgery was concentrated in the first 6 months at the population level, with only small additional mean change through 24 months. That apparent late plateau did not imply patient-level stability, because responder-state transitions remained common. Neither preoperative hemoglobin nor diagnostic group modified the temporal shape of ODI recovery, although spinal deformity was associated with a higher postoperative disability burden. The findings support treating follow-up time as clinically meaningful information: early assessments can characterize average recovery efficiently, whereas repeated later measurements remain necessary when the objective is to understand individual trajectories rather than a single long-term endpoint.
Declarations
Author contributions (CRediT): Maria Cesarina May: Conceptualization, Methodology, Formal analysis, Validation, Writing – original draft, Writing – review & editing. Andrea Zanirato: Conceptualization, Methodology, Formal analysis, Validation, Writing – original draft, Writing – review & editing. Eugenio Giannarelli: Conceptualization, Methodology, Formal analysis, Validation, Writing – original draft, Writing – review & editing. Matteo Formica: Conceptualization, Methodology, Formal analysis, Validation, Writing – original draft, Writing – review & editing. All authors contributed substantially to the study, reviewed the final manuscript, and approved its content.
Funding: This research received no external funding.
Ethics approval: This secondary analysis used only a publicly available dataset released under CC BY 4.0 and without direct participant identifiers. No participant contact or new data collection occurred. The source article reports that ethical review and approval were not required under applicable local legislation and institutional requirements [11].
Informed consent: No new participant contact or data collection occurred. The source publication states that written informed consent was not required under the applicable national legislation and institutional requirements [11].
Data and code availability: The source dataset is available from Mendeley Data, Version 2, DOI 10.17632/gs64pw256c.2, under CC BY 4.0 [12]. Supplementary File S1 contains the additional analyses and Tables S1-S8. Supplementary File S2 - Reproducibility Package contains analysis-ready datasets, the frozen SAP, statistical code, machine-readable outputs, the executed Jupyter notebook, and publication figures.
Trial or protocol registration: Source registry: ClinicalTrials.gov NCT03644407. Secondary-analysis SAP v1.0 frozen 10 October 2026; not prospectively preregistered.
Conflicts of interest: The authors declare no conflicts of interest.
Acknowledgements: The authors thank Matteo Briguglio and colleagues for conducting the original SPINEREG study and making the underlying dataset openly available, thereby enabling this independent secondary analysis [11,12].
Generative AI disclosure: OpenAI ChatGPT was used under human supervision to assist with analysis-code drafting, quality-control scripting, figure redesign, manuscript drafting, reference verification, and language refinement. Human authors remain responsible for the research question, analytical decisions, verification of outputs and references, interpretation, and final manuscript content.
Source provenance and supplementary materials
Data, Code & Reproducibility
The analysis-ready data, executable notebook, analysis scripts, data dictionary, frozen statistical analysis plan, machine-readable outputs, figure-generation code, dependency specifications, quality-control records and checksums are provided in Supplementary File S2.
References
- Finkelstein, Joel A, Schwartz, Carolyn E. Patient-reported outcomes in spine surgery: past, current, and future directions. Journal of Neurosurgery: Spine. 2019;31(2):155-164. DOI: https://doi.org/10.3171/2019.1.SPINE18770
- Fairbank, Jeremy C T, Pynsent, Paul B. The Oswestry Disability Index. Spine. 2000;25(22):2940-2952. DOI: https://doi.org/10.1097/00007632-200011150-00017
- Glassman, Steven D, Schwab, Frank, Bridwell, Keith H, Shaffrey, Christopher, Horton, William, Hu, Serena. Do 1-year outcomes predict 2-year outcomes for adult deformity surgery?. The Spine Journal. 2009;9(4):317-322. DOI: https://doi.org/10.1016/j.spinee.2008.06.450
- Fekete, Tamas F, Loibl, Markus, Jeszenszky, Dezso, Haschtmann, Daniel, Banczerowski, Peter, Kleinstuck, Frank S, Becker, Hans-Jorg, Porchet, Francois, Mannion, Anne F. How does patient-rated outcome change over time following the surgical treatment of degenerative disorders of the thoracolumbar spine?. European Spine Journal. 2018;27(3):700-708. DOI: https://doi.org/10.1007/s00586-017-5358-2
- Zuckerman, Scott L, Lai, Christopher S, Shen, Yong, Cerpa, Meghan, Lee, Nathan J, Kerolus, Mena G, Ha, Alex S, Buchanan, Ian A, Devin, Clinton J, Lehman, Ronald A, Lenke, Lawrence G. Do Adult Spinal Deformity Patients Undergoing Surgery Continue to Improve From 1-Year to 2-Years Postoperative?. Global Spine Journal. 2023;13(4):1080-1088. DOI: https://doi.org/10.1177/21925682211019352
- Azam, Faraaz, Furtado, Kailee, Anand, Soummitra, Dragun, Anthony, Nguyen, Madelina, Shukla, Ishav, Hicks, William H, Hall, Kristen, Akbik, Omar, Bagley, Carlos A. Trends of the Oswestry Disability Index in Adult Spinal Deformity Patients: A 3-Year Study. World Neurosurgery. 2024;181:e947-e952. DOI: https://doi.org/10.1016/j.wneu.2023.11.018
- Greenberg, Jacob K, Kelly, Michael P, Landman, Joshua M, Zhang, Justin K, Bess, Shay, Smith, Justin S, Lenke, Lawrence G, Shaffrey, Christopher I, Bridwell, Keith H. Individual differences in postoperative recovery trajectories for adult symptomatic lumbar scoliosis. Journal of Neurosurgery: Spine. 2022;37(3):429-438. DOI: https://doi.org/10.3171/2022.2.SPINE211233
- Hebert, Jeffrey J, Abraham, Edward, Wedderkopp, Niels, Bigney, Erin, Richardson, Eden, Darling, Mariah, Hall, Hamilton, Fisher, Charles G, Rampersaud, Y Raja, Thomas, Kenneth C, Jacobs, Bradley, Johnson, Michael, Paquet, Jerome, Attabib, Najmedden, Jarzem, Peter, Wai, Eugene K, Rasoulinejad, Parham, Ahn, Henry, Nataraj, Andrew, Stratton, Alexandra, Manson, Neil. Patients undergoing surgery for lumbar spinal stenosis experience unique courses of pain and disability: A group-based trajectory analysis. PLOS ONE. 2019;14(11):e0224200. DOI: https://doi.org/10.1371/journal.pone.0224200
- Wang, Shuaijin, Hebert, Jeffrey J, Abraham, Edward, Vandewint, Amanda, Bigney, Erin, Richardson, Eden, El-Mughayyar, Dana, Attabib, Najmedden, Wedderkopp, Niels, Kingwell, Stephen, Soroceanu, Alex, Weber, M H, Hall, Hamilton, Finkelstein, Joel, Bailey, Christopher S, Thomas, Kenneth, Nataraj, Andrew, Paquet, Jerome, Johnson, Michael G, Fisher, Charles, Rampersaud, Y Raja, Dea, Nicolas, Small, Chris, Manson, Neil. Postoperative recovery patterns following discectomy surgery in patients with lumbar radiculopathy. Scientific Reports. 2022;12(1):11146. DOI: https://doi.org/10.1038/s41598-022-15169-8
- Halvorson, Ryan T, Torres-Espin, Abel, Callahan, Matthew, Tay, Bobby, O Neill, Conor, Berven, Sigurd, Lotz, Jeffrey C, Bailey, Jeannie F. Multi-domain biopsychosocial postoperative recovery trajectories associate with patient outcomes following lumbar fusion. European Spine Journal. 2023;32(4):1429-1436. DOI: https://doi.org/10.1007/s00586-023-07572-0
- Briguglio, Matteo, Perazzo, Paolo, Langella, Francesco, Crespi, Tiziano, De Vecchi, Elena, Riso, Patrizia, Porrini, Marisa, Scaramuzzo, Laura, Bassani, Roberto, Brayda-Bruno, Marco, Banfi, Giuseppe, Berjano, Pedro. Prediction of Long-Term Recovery From Disability Using Hemoglobin-Based Models: Results From a Cohort of 1,392 Patients Undergoing Spine Surgery. Frontiers in Surgery. 2022;9:850342. DOI: https://doi.org/10.3389/fsurg.2022.850342
- Briguglio, Matteo. Hemoglobin and Recovery from Disability after Spine Surgery (SPINEREG; PI: M Briguglio). Mendeley Data. 2025:Version 2. DOI: https://doi.org/10.17632/gs64pw256c.2
- von Elm, Erik, Altman, Douglas G, Egger, Matthias, Pocock, Stuart J, Gotzsche, Peter C, Vandenbroucke, Jan P, STROBE Initiative. The Strengthening the Reporting of Observational Studies in Epidemiology (STROBE) Statement: guidelines for reporting observational studies. The Lancet. 2007;370(9596):1453-1457. DOI: https://doi.org/10.1016/S0140-6736(07)61602-X
- Benchimol, Eric I, Smeeth, Liam, Guttmann, Astrid, Harron, Katie, Moher, David, Petersen, Irene, Sorensen, Henrik T, von Elm, Erik, Langan, Sinead M, RECORD Working Committee. The REporting of studies Conducted using Observational Routinely-collected health Data (RECORD) Statement. PLOS Medicine. 2015;12(10):e1001885. DOI: https://doi.org/10.1371/journal.pmed.1001885
- Ostelo, Raymond W J G, Deyo, Rick A, Stratford, P, Waddell, Gordon, Croft, Peter, Von Korff, Michael, Bouter, Lex M, de Vet, Henrica C. Interpreting change scores for pain and functional status in low back pain: towards international consensus regarding minimal important change. Spine. 2008;33(1):90-94. DOI: https://doi.org/10.1097/BRS.0b013e31815e3a10
- Asher, Anthony M, Oleisky, Emily R, Pennings, Jacquelyn S, Khan, Inamullah, Sivaganesan, Ahilan, Devin, Clinton J, Bydon, Mohamad, Asher, Anthony L, Archer, Kristin R. Measuring clinically relevant improvement after lumbar spine surgery: is it time for something new?. The Spine Journal. 2020;20(6):847-856. DOI: https://doi.org/10.1016/j.spinee.2020.01.010
- Copay, Anne G, Glassman, Steven D, Subach, Brian R, Berven, Sigurd, Schuler, Thomas C, Carreon, Leah Y. Minimum clinically important difference in lumbar spine surgery patients: a choice of methods using the Oswestry Disability Index, Medical Outcomes Study questionnaire Short Form 36, and pain scales. The Spine Journal. 2008;8(6):968-974. DOI: https://doi.org/10.1016/j.spinee.2007.11.006
- Mannion, Anne F, Fekete, Tamas F, O Riordan, Dave, Loibl, Markus, Kleinstuck, Frank S, Porchet, Francois, Reitmeir, Raluca, Jeszenszky, Dezso, Haschtmann, Daniel. Does loss to follow-up lead to an overestimation of treatment success? Findings from a spine surgery registry of over 15,000 patients. European Spine Journal. 2023;32(3):813-823. DOI: https://doi.org/10.1007/s00586-023-07541-7
- Solberg, Tore K, Sorlie, Andreas, Sjaavik, Kristin, Nygaard, Oystein P, Ingebrigtsen, Tor. Would loss to follow-up bias the outcome evaluation of patients operated for degenerative disorders of the lumbar spine?. Acta Orthopaedica. 2011;82(1):56-63. DOI: https://doi.org/10.3109/17453674.2010.548024
- Geere, Jonathan H, Hunter, Paul R, Cook, Andrew J, Rai, Amarjit S. Can 3-month models or observed 3- or 6-month patient-reported outcome measures accurately predict 12-month disability and pain after lumbar decompressive surgery?. Archives of Orthopaedic and Trauma Surgery. 2025;145(1):260. DOI: https://doi.org/10.1007/s00402-025-05877-x